
Figures & data
Table 1 Demographic Data of Study Population
Figure 1 Flow chart.
Abbreviations: MRSA, methicillin resistant Staphylococcus aureus; MICU, medical intensive care unit.
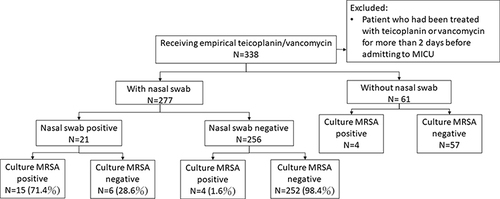
Table 2 NPV, PPV, Sensitivity and Specificity of MRSA Nasal Screening by Types of Infections
Table 3 Patients with or without MRSA Nasal Screening in Medical Intensive Care Unitsa