Figures & data
Figure 1 A schematic of the mechanism of CCL25 in the pathogenesis of ALI.
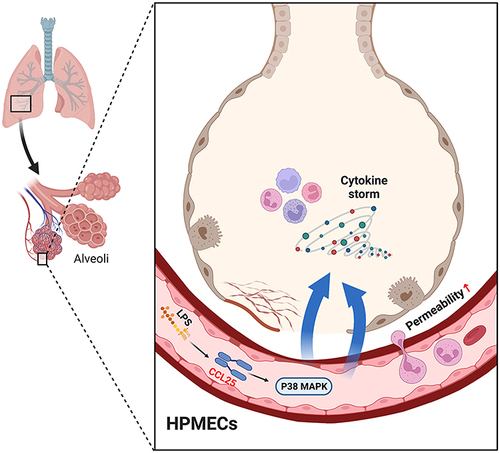
Table 1 General Characteristics of the Participants Involved in This Study
Figure 2 Expression levels of chemokines in sepsis patients. (A) Expression levels of chemokine CCL19 in sepsis patients. (B) Expression levels of chemokine CCL21 in sepsis patients. (C) Expression levels of chemokine CCL25 in sepsis patients. P<0.05 indicated significant difference, ***P<0.001. The experiments were repeated three times.
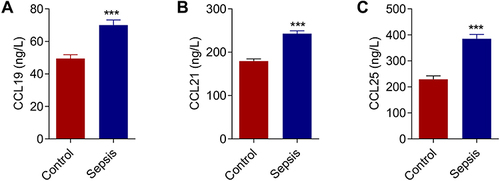
Figure 3 Up-regulation of CCL25 expression in HPMEC upon LPS treatment. (A) Protein expression and relative mRNA expression of CCL25 after treatment of HPMEC with 0, 25, 50, 100 and 200 ng/mL LPS, respectively, compared with 0 ng/mL LPS group. (B) Protein expression and mRNA relative expression of CCL25 at 0h, 12h, 24h, 48h after treatment of HPMEC with 100 ng/mL LPS. (C and D) The relative expression of CCL25 mRNA. *P<0.05, **P<0.01, ***P<0.001, compared with the 0 h group. The experiments were repeated three times.
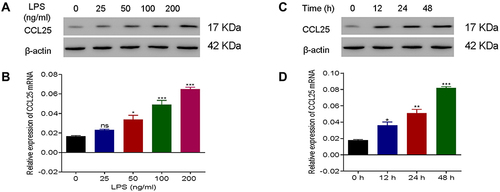
Figure 4 Anti-CCL25 reduced inflammatory cytokine expressions and endothelial permeability in LPS-treated HPMECs. 0, 100 and 200 ng/mL Anti-CCL25 were added to 100 ng/mL LPS-induced HPMECs, respectively. (A) TEER assay. (B) FITC fluorescence intensity assay. (C) ELISA detect to the expression of TNF-α. (D) ELISA to detect the expression of IL-1β. (E) ELISA to detect the expression of IL-6. (F) Western blotting to detect the protein expression of P38, p-P38, occludin and ZO-1. P<0.05 indicated significant difference, ***P<0.001, compared with control group; **P<0.01, ***P<0.001, compared with LPS+ 0 ng/mL Anti-CCL25 group. The experiments were repeated three times.
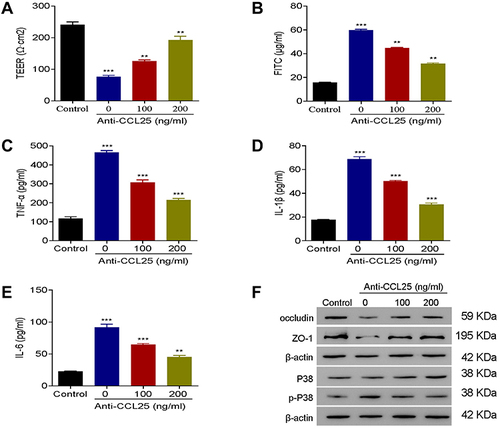
Figure 5 Recombinant protein CCL25 increased endothelial permeability and CCL25 expression in HPMECs. HPMEC were treated with 0, 25, 50, 100 and 200 ng/mL recombinant CCL25. (A) TEER assay. (B) FITC fluorescence intensity assay. P<0.05 indicated significant difference, *P<0.05, **P<0.01, ***P<0.001. The experiments were repeated three times.
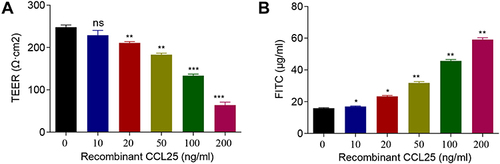
Figure 6 P38 inhibition reduced inflammatory cytokines expressions and endothelial permeability in CCL25-treated HPMEC. (A) FITC fluorescence intensity assay. (B) TEER assay. (C) ELISA detect to the expression of TNF-α. (D) ELISA to detect the expression of IL-1β. (E) ELISA to detect the expression of IL-6. (F) Western blotting to detect the protein expression of P38, p-P38, occludin and ZO-1. P<0.05 indicated significant difference. **P<0.01, ***P<0.001, compared with control group; #P<0.05, ##P<0.01, ###P<0.001, compared with vehicle group. The experiments were repeated three times.
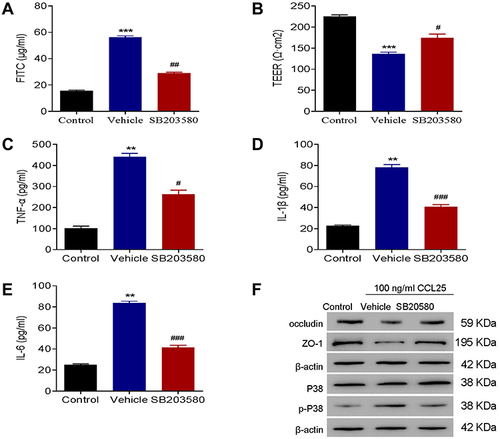
Figure 7 NF-κB inhibitor suppressed expression of CCL25. (A) The expression of CCL25. (B) Relative expression of CCL25 mRNA. (C) Western blotting to detect the protein expression of CCL25, NF-κB (plasma) and NF-κB (nucleus). (D) Luciferase assays. (E) ChIP analysis. The input was used as an internal positive control. P<0.05 indicated significant difference. **P<0.01, ***P<0.001, compared with control group; ##P<0.01, ###P<0.001, compared with vehicle group. The experiments were repeated three times.
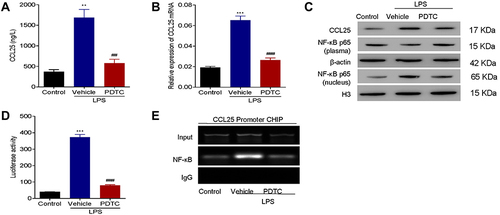
Figure 8 The combination of NF-κB inhibitor with recombinant CCL25 increased cell permeability and inflammatory cytokine expression. (A) TEER assay. (B) FITC fluorescence intensity assay. (C) ELISA detect to the expression of CCL25. (D) ELISA detect to the expression of TNF-α. (E) ELISA to detect the expression of IL-1β. (F) ELISA to detect the expression of IL-6. (G) Western blotting to detect the protein expression of CCL25, P38, p-P38, occludin and ZO-1. P<0.05 indicated significant difference, *P<0.05, **P<0.01, ***P<0.001. The experiments were repeated three times.
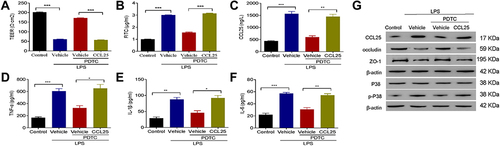
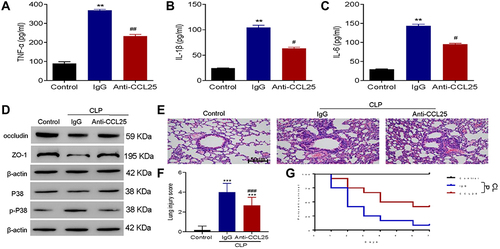
Figure 9 Anti-CCL25 reduced the levels of inflammatory cytokines and improved the survival of sepsis mice. Totally 36 mice were divided into control group, CLP model control group (IgG), CLP model group (Anti-CCL25), with 12 in each group. (A) ELISA detect to the expression of TNF-α. **P<0.01 compared with control group; ##P<0.01 compared with IgG group. (B) ELISA to detect the expression of IL-1β. **P<0.01 compared with control group; #P<0.05 compared with IgG group. (C) ELISA to detect the expression of IL-6. **P<0.01 compared with control group; #P<0.05 compared with IgG group. (D) Western blotting to detect the protein expression of P38, p-P38, occludin and ZO-1. (E) HE staining of lung injury, magnification: x200. (F) Pathological score of lung injury. ***P<0.001, compared with control group; ###P<0.001, compared with IgG group. (G) Survival rate. P<0.05 indicated significant difference. The experiments were repeated three times.