Figures & data
Table 1 General Information on Patients with Sepsis
Table 2 Association of Clinical Features with Patient Prognosis
Table 3 Association of Laboratory Indicators with Patient Prognosis
Table 4 Comparison of Blood Culture Results of Patients with Sepsis
Table 5 Isolation Number and Composition Ratio of Pathogens in Blood Culture
Table 6 Susceptibility Rates of Clinically Isolated Gram-Positive Cocci to Antibiotics (%)
Table 7 Susceptibility Rate of Main Isolated Gram-Negative Bacteria to Antibiotics (%)
Table 8 Multivariate Logistic Regression Analysis Results of Sepsis in Patients with Sepsis
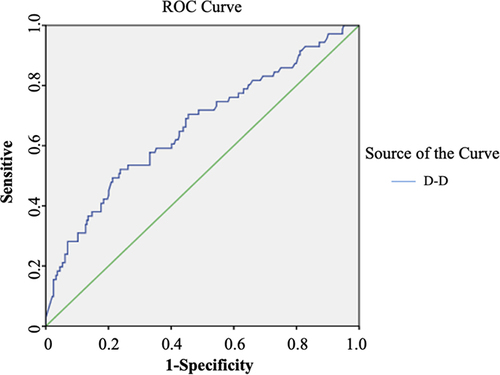
Table 9 ROC Curve Analysis Results for D-Dimer Levels
Figure 1 ROC curve of D-dimer levels for predicting sepsis outcome.