
Figures & data
Table 1 Primers Implemented for PCR Assay and Target Mutations
Table 2 Antimicrobial Susceptibility Results of 412 N. gonorrhoeae Isolates (Number of Strains Were Indicated in Parentheses)
Figure 1 Correlation between MICs of four tetracycline antibiotics and tetracycline, ceftriaxone or azithromycin. Each symbol with specific numbers and colors represents one or multiple isolates. MIC values were log-transformed (log2) before calculating the regression line. (A–D) Correlation between MICs of minocycline, tigecycline, eravacycline, omadacycline and ceftriaxone. (E–H) Correlation between MICs of minocycline, tigecycline, eravacycline, omadacycline and azithromycin. (I–L) Correlation between MICs of minocycline, tigecycline, eravacycline, omadacycline and tetracycline.
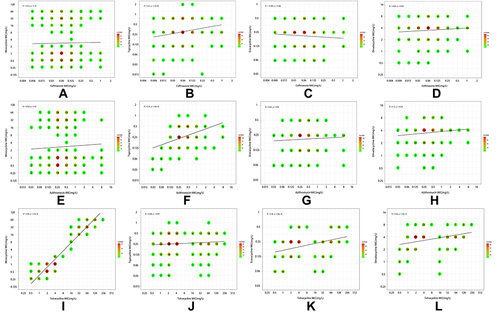
Table 3 Presence of Resistance Determinants in N. gonorrhoeae Strains Displaying High Tigecycline MICs or Low Tigecycline MICs