Figures & data
Table 1 The Baseline Characteristics of PLWH and HDs
Table 2 Baseline Characteristics of PLWH
Table 3 Safety of Inactivated COVID-19 Vaccination in PLWH
Figure 1 Longitudinal changes in antibody response in PLWH since whole-course vaccination. The blue line and strip represent the general trend line and confidence interval, which were calculated using the locally weighted scatterplot smoothing algorithm. Correlation between time since two doses of vaccines and the neutralization antibody titers against the D614G variant (A), Delta variant (B), and IgG (C).
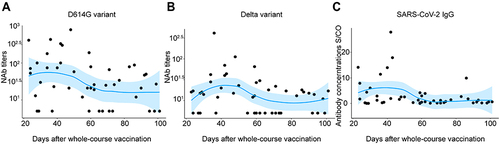
Table 4 Baseline Comparison Between Selected PLWH and HDs
Figure 2 The antibody immune responses of inactivated vaccines against SARS-CoV-2. Lines through the boxes represent medians, the width of the boxes represent IQR, the whiskers represent the upper quartile and the lower quartile, and dots indicate points beyond 1.5 times the IQR. (A) Comparison of neutralizing antibodies to the D614G and Delta variants between PLWH and HDs. (B) Comparison of SARS-CoV-2 IgG antibodies between PLWH and HDs. (C) Comparison of neutralizing antibody (NAb) titers between D614G and Delta variants in PLWH and HDs.
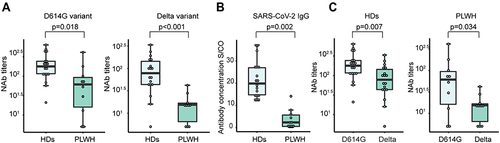
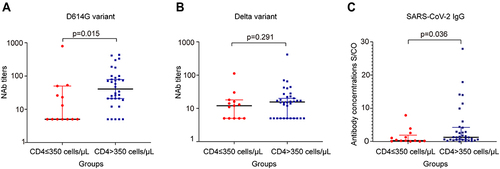
Table 5 The Baseline Characteristics Between Groups with Different CD4+ T Cell Counts
Figure 3 The difference in antibody responses between patients with difference CD4+ T cell counts. PLWH were divided into patients with CD4 + T cell counts≤350 μL and CD4+ T cell counts>350 μL. The difference in NAb titers against the D614G variant (A), the delta variant (B), and the concentration of SARS-Cov-2 IgG (C) between the two groups was shown. The short black lines indicate mean and 95% CI.