Figures & data
Table 1 The Isolation, MIC Range, Carba-NP Test, and PCR Detections of Resistance Genes Distribution Among the Three STs
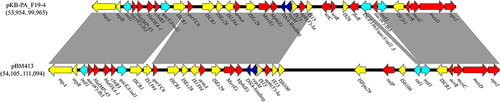
Figure 1 The OprD mutations of KB_ST292 (ST292 clones in Kunming burn ward) and compared with PAO1. (A) Deletion of 1088_1100del13 leads to a frame-shift mutation and early termination at 1050–1052, *=Terminor; (B) Locations of amino acid substitutions (14 sites) and a 12-amino acid mutation.
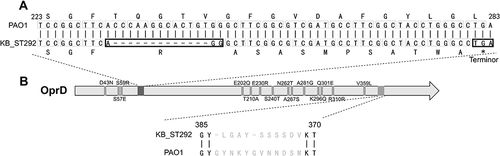
Figure 2 Out membrane profiling determined by SDS-PAGE; PAO1, reference P. aeruginosa strain; ST292, ST244, ST2446, representative clinical isolates. M, molecular size marker (Thermo). The arrow on the upper right indicates the banding position of OprD.
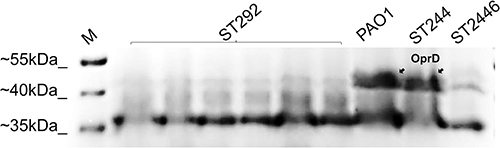
Table 2 Chromosome Statistics of P. aeruginosa Strains
Figure 3 Mauve alignment for chromosomes of KB-PA_3, PAO1 and KB-PA_F19; Chromosomes shows locally colinear blocks of matched colored regions. The gap between locally colinear blocks shows the additional regions.
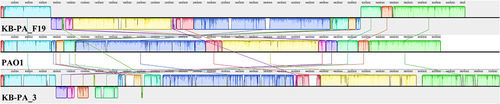
Table 3 Plasmids Identified in P. aeruginosa Strains
Figure 4 Phylogenetic tree of blaIMP-87 and blaIMP-45 with 31 sub-types of blaIMP; Phylogenetic tree was constructed based on neighbor-Joining by MEGA 6.0. blaIMP-45 is labeled with blue and blaIMP-87 with red.
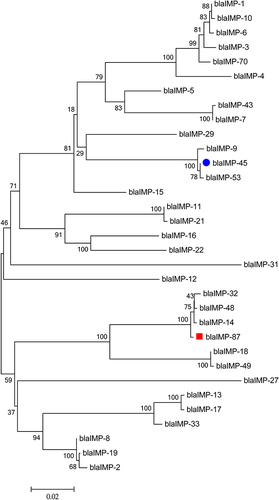
Figure 5 Schematic representation of blaIMP-87 gene context of KB-PA_3, and intI1 comparison between of pEC732-IMP, KB-PA_3 and S27-KUU; Open arrows indicate coding sequences and direction of transcription. Resistance genes (Red); transposon module (yellow); integron module (sky blue); insertion sequence of IS1017 (green). S27-KUU only reported the gene cassette array, and we add the possible integron module in the gray box. Shaded areas between the genetic elements indicate homology (≥95% identity).
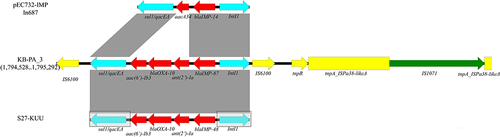
Figure 6 Resistance region comparison between pKB-PA_F19-4 and pBM413; Open arrows indicate coding sequences and direction of transcription. Resistance genes (Red); transposon module (yellow); integron module (sky blue); repM and DNA-binding protein gene (dark blue). Shaded areas between the genetic elements indicate homology (≥95% identity).