Figures & data
Table 1 Summary of the Statements and Their Percentage of Agreement
Figure 1 Lung ultrasonography of a mild COVID-19 case with a normal aerated lung. (A) A bright, thin, smooth pleural line between the two ribs and A-lines are seen as horizontal repetitions of the pleural line between the shadows of the two ribs. (B) Normal lung sliding (seashore sign using M mode). T: T lines are vertical lines, in time with cardiac pulsation, running from the pleural line to the bottom of the image.
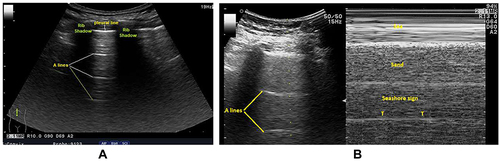
Figure 2 LUS of a patient with COVID-19 with a partially de-aerated lung showing the absence of A-lines, bilateral peripheral multiple spaced (B) B-lines (A), and thick and/or irregular pleural line, subpleural consolidation, and confluent B-line (B).
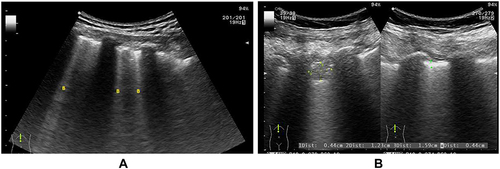
Figure 3 B-lines with patchy distribution and spared areas. Left: Speared area with A-pattern; smooth pleural line and A-lines. Right: B-pattern; irregular pleural line and multiple spaced B-lines (poor lung aeration).
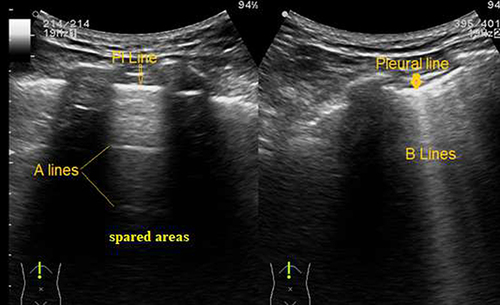
Table 2 Different Protocols for the Lung Ultrasound Scoring System
Figure 4 The lung ultrasonography score, based on the examination of 12 regions of interest (six on the right side and six on the left side), has been proposed to assess lung aeration changes caused by different pathological lung conditions. PSL: AAL: PAL: PVL.
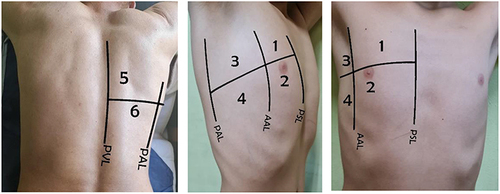
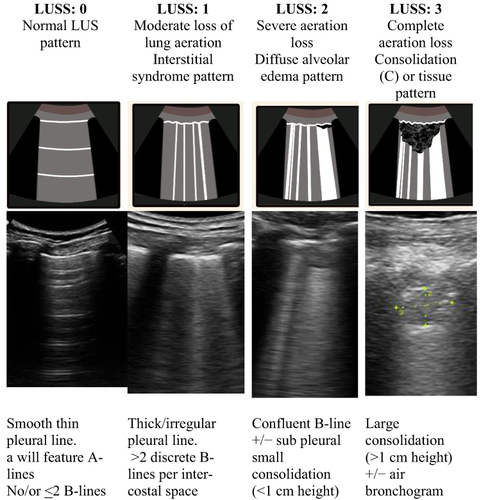
Figure 5 LUS score (LUSS) according to sonographic pattern: For each region, we allocated points, ranging from 0 to 3, according to the poorest ultrasound pattern observed. 0 = normal aeration, 1 = interstitial syndrome, 2 = alveolar edema, and 3 = consolidation. The final LUSS is the sum of the points in all 12 regions, which ranges from 0 to 36. Accordingly, the grading the disease severity index can be estimated: mild (score <5), moderate (<15), and severe (>15).