Figures & data
Figure 1 Flow chart of patients enrolled in this study. We screened 5144 cases with blood culture data and excluded 3582 cases of GNB bacteremia. After further exclusion of 452 contaminated cultures, 233 single set blood cultures, and 2 cases of out-of-hospital cardiac arrest (OHCA) without return of spontaneous circulation (ROSC), 875 cases of GPC bacteremia remained. Furthermore, 191 Enterococcus bacteremia cases were analyzed after excluding 450 Staphylococcus and 231 Streptococcus cases. A total of 191 patients with enterococcal bacteremia (55 patients with VRE bacteremia [case group] and 136 patients with VSE bacteremia [control group]) were included in the analysis.
![Figure 1 Flow chart of patients enrolled in this study. We screened 5144 cases with blood culture data and excluded 3582 cases of GNB bacteremia. After further exclusion of 452 contaminated cultures, 233 single set blood cultures, and 2 cases of out-of-hospital cardiac arrest (OHCA) without return of spontaneous circulation (ROSC), 875 cases of GPC bacteremia remained. Furthermore, 191 Enterococcus bacteremia cases were analyzed after excluding 450 Staphylococcus and 231 Streptococcus cases. A total of 191 patients with enterococcal bacteremia (55 patients with VRE bacteremia [case group] and 136 patients with VSE bacteremia [control group]) were included in the analysis.](/cms/asset/d8d7a54b-fe26-4751-9c1b-84365870841e/didr_a_354701_f0001_c.jpg)
Table 1 Comparisons of Demographic Characteristics Between Critically Ill Patients with VRE Bacteremia and Those with VSE Bacteremia
Table 2 Univariate and Multivariate Logistic Regression Analyses to Identify Variables Associated with Vancomycin-Resistant Enterococcus (VRE) Bacteremia in Critically Ill Patients with Enterococcus Bacteremia
Table 3 Comparisons of Clinical Outcomes Between Patients with VRE Bacteremia and Those with VSE Bacteremia
Table 4 Cox Regression Model to Determine Factors Associated with All-Cause 28-Day Mortality
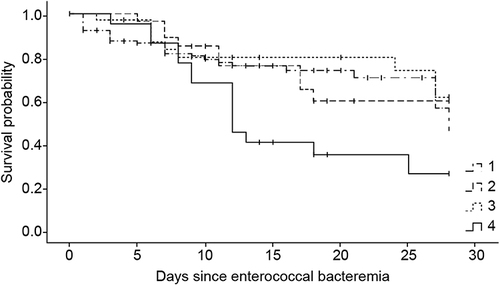
Figure 2 Survival curves according to VRE or VSE bacteremia and the time to appropriate antibiotic administration after GPC bacteremia diagnosis (four groups). The Kaplan–Meier survival analysis was adopted for patients with (1) VSE bacteremia with time to appropriate antibiotic administration ≤3 days, (2) VSE bacteremia with time to appropriate antibiotic administration >3 days, (3) VRE bacteremia with time to appropriate antibiotic administration ≤3 days, and (4) VRE bacteremia with time to appropriate antibiotic administration >3 days during their hospital stay (cut-off point: 28 days). Log rank test: p<0.05.