Figures & data
Table 1 Distribution of Sex, Age, Educational Level, Occupational Status, Category of Patients, and Types of TB Diagnosis in Jimma Health Center, Jimma Town, Oromia Region, South West Ethiopia from September 11, 2006–September 10, 2017
Table 2 Distribution of TB Treatment Outcome in Jimma Health Center, Jimma Town, Oromia Region, South West Ethiopia from September 11, 2006–September 10, 2017
Table 3 Distribution of Category of TB and Patient Diagnosis with Treatment Outcome in Jimma Health Center, Jimma Town, Oromia Region, Southwest Ethiopia from September 11, 2006–September 10, 2017
Table 4 Distribution of Types of TB Diagnosis According to Age and Sex of Patients in Jimma Health Center, Jimma Town, Oromia Region, South West Ethiopia from September 11, 2006–September 10, 2017
Table 5 Distribution of Age, Sex, Educational Level, Occupational Status, Types of TB, and Category of Patients in Relation to Their Treatment Outcome in Jimma Health Center, Jimma Town, Oromia Region, South West Ethiopia from September 11, 2006–September 10, 2017
Table 6 Distribution of Individual Factors Associated with Treatment Outcome of TB Patients in Jimma Health Center, Jimma Town, Oromia Region, South West Ethiopia from September 11, 2006–September 10, 2017
Table 7 Distribution of Sex, Age, Educational Level, Occupational Status, Category of Patients, and Types of TB Diagnosis in Jimma Medium Clinic, Jimma Town, Oromia Region, South West Ethiopia from September 11, 2006–September 10, 2017
Table 8 Distribution of TB Treatment Outcome in Jimma Medium Clinic, Jimma Town, Oromia Region, South West Ethiopia from September 11, 2006–September 10, 2017
Table 9 Distribution of Category of TB and Patient Diagnosis with Treatment Outcome in Jimma Medium Clinic, Jimma Town, Oromia Region, Southwest Ethiopia from September 11, 2006–September 10, 2017
Table 10 Distribution of Types of TB Diagnosis According to Age and Sex of Patients in Jimma Medium Clinic, Jimma Town, Oromia Region, South West Ethiopia from September 11, 2006–September 10, 2017
Table 11 Distribution of Age, Sex, Educational Level, Occupational Status, Types of TB, and Category of Patients in Relation to Their Treatment Outcome in Jimma Medium Clinic, Jimma Town, Oromia Region, South West Ethiopia from September 11, 2006–September 10, 2017
Table 12 Distribution of Age, Sex, Educational Level, Occupational Status, Types of TB, and Category of Patients in Relation to Their Treatment Outcome in Both Jimma Medium Clinic and Jimma Health Center, Jimma Town, Oromia Region, South West Ethiopia from September 11, 2006–September 10, 2017
Figure 1 Trend of all types of registered TB cases in Jimma Medium Clinic and Jimma Health Center September 12, 2017–September 2017.
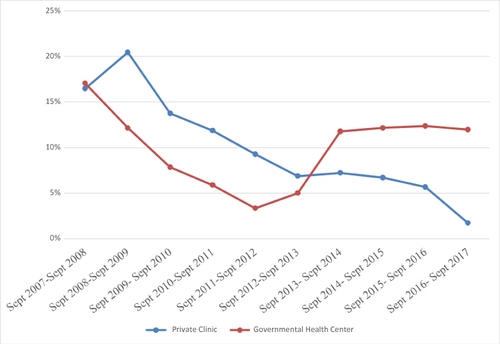
Figure 2 The overall treatment outcome of Jimma Medium Clinic and Jimma Health Center.
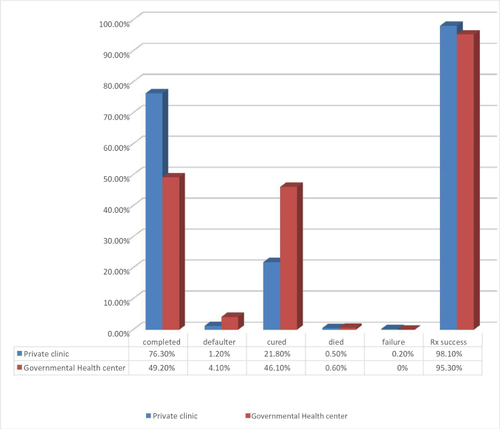
Figure 3 Patient age with TB treatment outcome in Jimma Medium Clinic and Jimma Health Center.
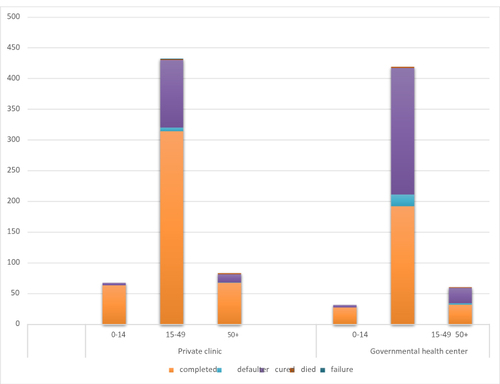
Figure 4 The sex of the patient with TB treatment outcome in Jimma Medium Clinic and Jimma Health Center.
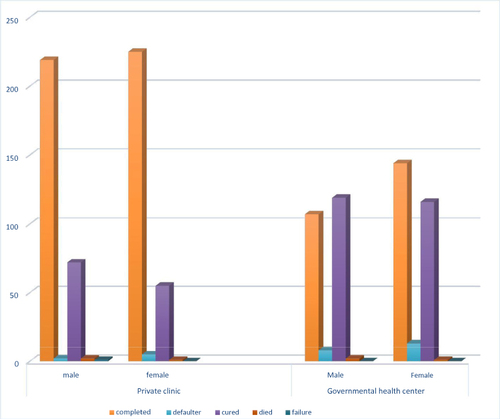
Figure 5 Educational level of the patient with the TB treatment outcome in Jimma Medium Clinic and Jimma Health Center.
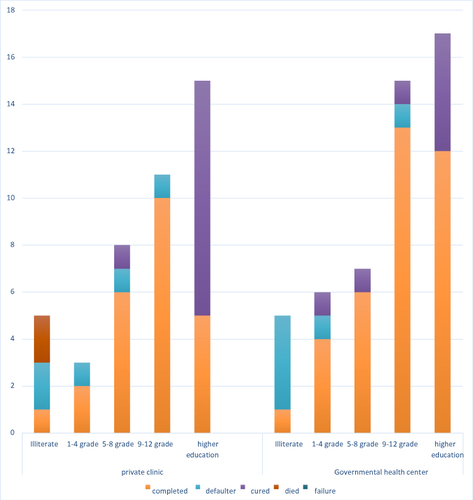
Figure 6 Occupational status of the patient with the TB treatment outcome in Jimma Medium Clinic and Jimma Health Center.
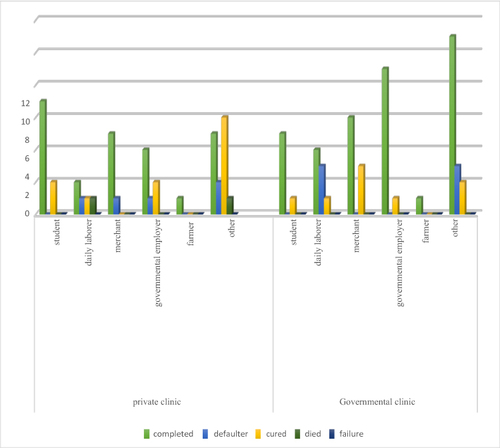
Figure 7 The type of TB with the TB treatment outcome in Jimma Medium Clinic and Jimma Health Center.
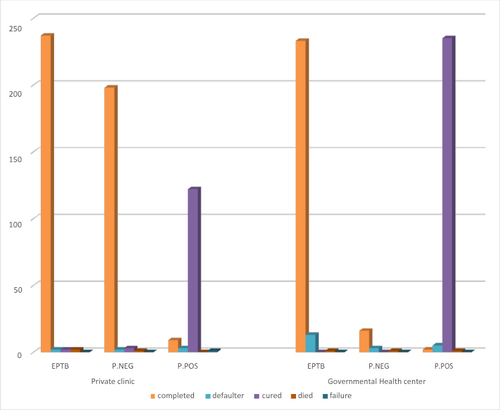
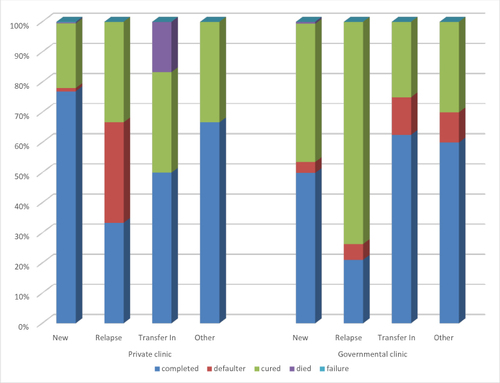
Figure 8 The category of the patient with the TB treatment outcome in Jimma Medium Clinic and Jimma Health Center.