Figures & data
Table 1 Antimicrobial Susceptibility and Efflux Pump Inhibition Tests of LZ00114
Figure 1 Microbial characteristics of LZ00114 were drawn by GraphPad Prism 9.2.0. (A) Motility test results of LZ00114. The data represents the average diameter of the swimming. (B) Growth dynamic curve of LZ00114 and Lab-WT E. coli ATCC25922 for 24h. (C) A total of three groups were allocated 15 G. mellonella larvae each. Two groups were infected with 105 CFU of LZ00114 and Lab-WT, respectively. The remaining group was injected with 10 µL PBS, which served as blank control. The error bar represents the standard deviation of the mean. **P < 0.01 by Log rank test.
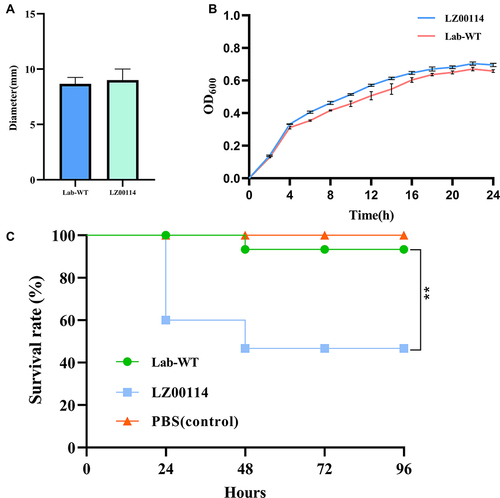
Table 2 General Characteristics of the LZ00114 Genomes
Figure 2 (A) Orthologous average nucleotide identity values of LZ00114, E. coli str. K-12 substr. MG1655 and other E. coli strains. E. coli ATCC25922 (GenBank accession number: CP009072.1). (B) The SNPs-based phylogenetic tree was constructed using LZ00114 and 6 E. coli genomes and visualized by FigTree v1.4.4 software. E. coli str.k-12 substr. MG1655 served as the reference genome.
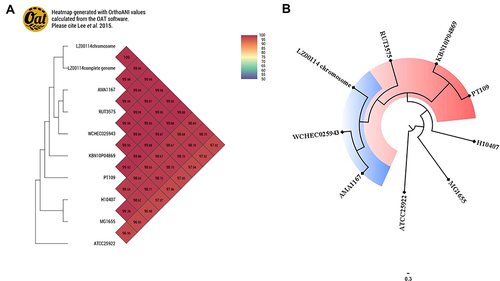
Figure 3 Circular genomic comparison of p25NDM-5 with three other plasmids drawn by BRIG software. Different colors represent plasmids from different isolates. Red bars indicate genetic annotations, and blank represents the missing region compared with the reference genome.
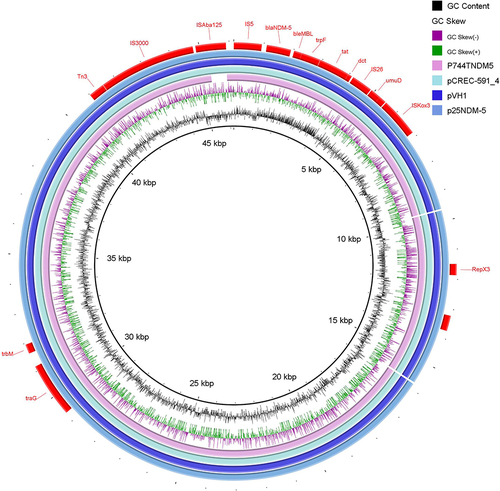
Figure 4 Circular genomic comparison of p1OXA77 with five other plasmids drawn by BRIG software. Different colors represent plasmids from different isolates. Black bars indicate genetic annotations, and blank represents the missing region compared with the reference genome.
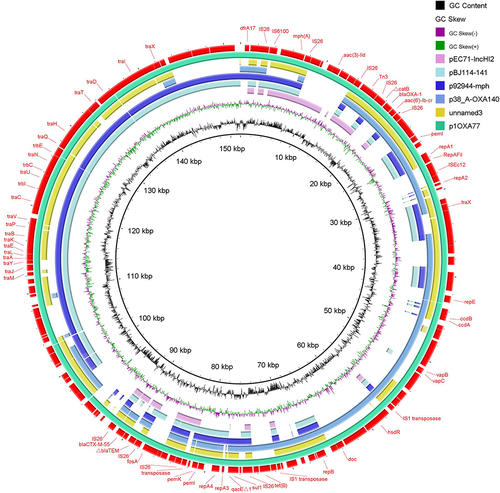
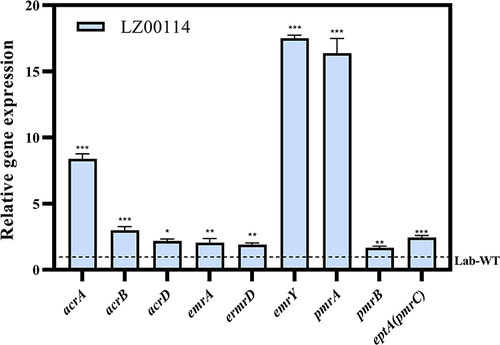
Figure 5 The gene transcriptional levels of pmrA, pmrB, eptA(pmrC), acrA, acrB, acrD, emrA, emrD and emrY were drawn by GraphPad Prism 9.2.0. *P < 0.05, **P < 0.01, ***P < 0.001 by Student’s t-test. The error bar represents the standard deviation of the mean.