Figures & data
Table 1 Demographic Data for the Study Population
Figure 1 Flowchart of patient inclusion.
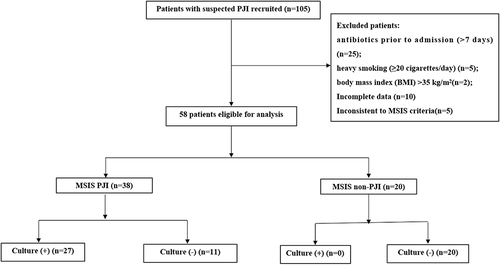
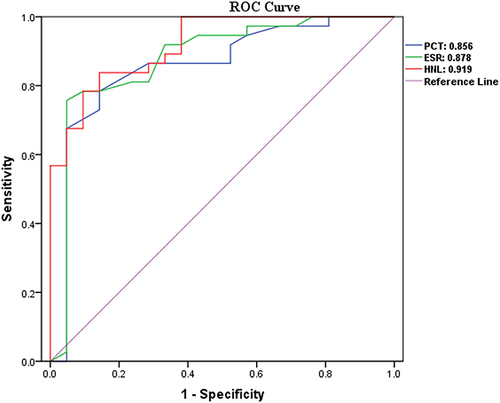
Table 2 Sensitivity, Specificity, Positive Predictive Value, Negative Predictive Value, and Accuracy of Inflammatory Markers
Figure 2 Comparison of different serum biomarkers levels between PJI group and non-PJI group. (A). There was not significantly different of D-dimer value between PJI group and non-PJI group (P = 0.414) (B). There was not significantly different of CRP value between PJI group and non-PJI group (P = 0.204) (C). There was significantly different of HNL level between PJI group and non-PJI group (P = 0.000) (D). The PCT value of the PJI group was significantly higher than that of the non-PCT group (P = 0.000) (E). There was significantly different of ESR level between PJI group and non-PJI group (P = 0.000).
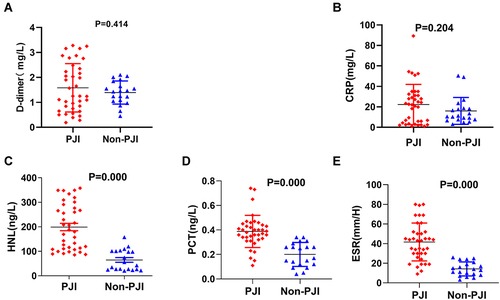
Figure 3 ROC curves for diagnostic indicators with an AUC >0.7, which included PCT, ESR, HNL.