Figures & data
Table 1 The Prevalence and Characteristics of Patients Infected with NTS Which Were Classified into Four Groups Based on the Number of Antimicrobials Resistances
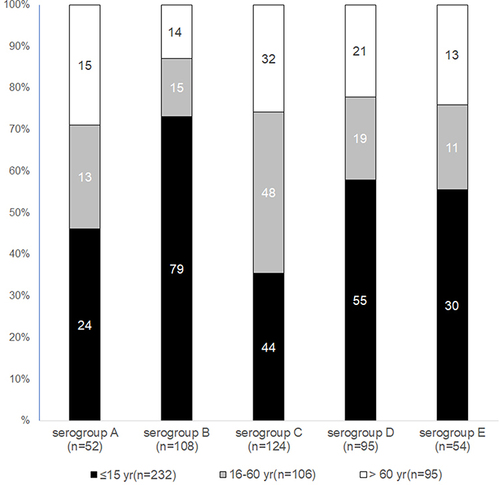
Figure 1 Percentage of antimicrobial resistance of all NTS patients since 2011 to 2020. By (A) shows the group of antimicrobials resistance rate which has been rising trend, while (B) shows similar or slight changes.
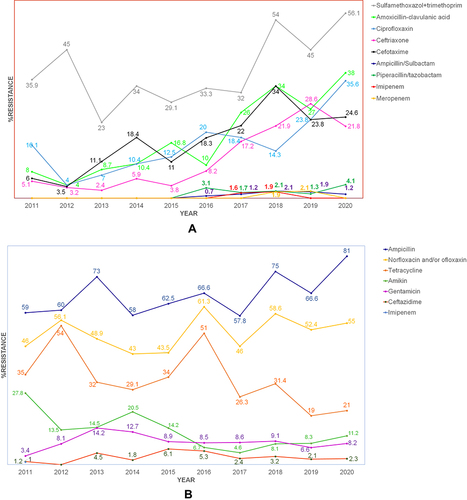
Figure 2 Antimicrobial resistance rate of NTS in invasive patients’ groups since 2011 to 2020. By (A) presents increase trend of non-susceptible rate of antimicrobials, while (B) presents similar or few changes.
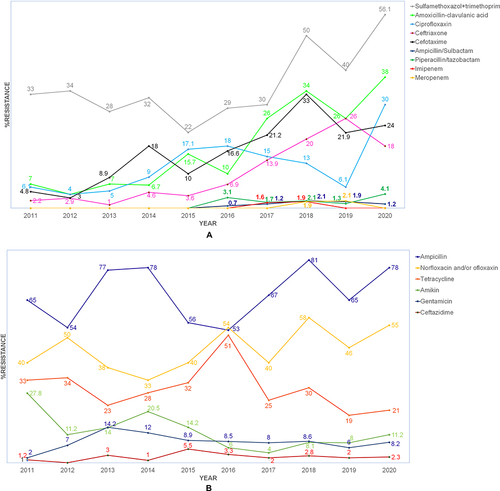
Table 2 Comparison the Antimicrobials Resistance Pattern (Ceftriaxone and Ciprofloxacin) by Serogroups of NTS Between 2011–2015 and 2016–2020
Figure 3 The prevalence rate and trend of MDR-NTS, 2011–2020. Black columns represent MDR-NTS. Grey columns represent NDR-NTS.
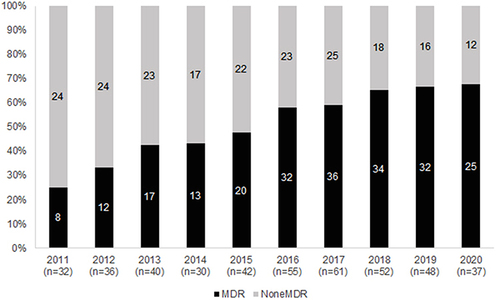
Table 3 Comparison the Length of Hospital Stays and Virulence Between NTS Serogroup
Figure 4 Number of infected patients NTS for each serogroup by age group. Black columns represent patients who are ≤ 15 years. Grey columns represent patients who are 16–60 years. White columns represent patients who are > 60 years.