Figures & data
Table 1 Comparison of Demographic Data and Hematological Parameters Between COVID-19 Patient Group and Control Group. The Statistical Analysis Between Groups Was Performed Using Chi-Squared Test for Age and Independent Unpaired t-test for Hematological Parameters. Date is Shown as Mean±SD
Table 2 Comparison of Inflammatory Parameters’ Values Between COVID-19 Patients and Control Group. The Statistical Analysis Between Groups Was Performed Using Independent Unpaired t-test for Hematological Parameters. Date is Shown as Mean±SD
Table 3 Comparison of Coagulation Profile Parameters and D-Dimers Values Between COVID-19 Patient Group and Healthy Control Group. The Statistical Analysis Between Groups Was Performed Using Independent Unpaired t-test for Hematological Parameters. Date is Shown as Mean±SD
Table 4 Comparison of Microvesicles and Tissue Factor-Bearing Microvesicles Levels Between COVID-19 Patient Group and Healthy Control Group. The Statistical Analysis Between Groups Was Performed Using Independent Unpaired t-test for Hematological Parameters. Date is Shown as Mean±SD
Figure 1 Levels of microvesicles (A) and tissue factor-bearing microvesicles (B) in COVID-19 patient compared to healthy controls. (A) Levels of microvesicles in the plasma of the study cohort. (B) Levels of tissue factor-bearing microvesicles in the plasma of the study cohort. Individual data of patients (n=40) and controls (n=37) are shown with mean line. The statistical analysis between groups was performed using independent unpaired t-test between the two groups.
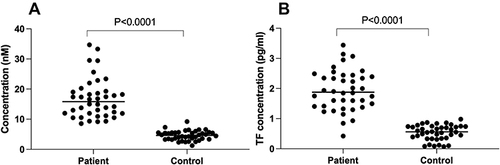
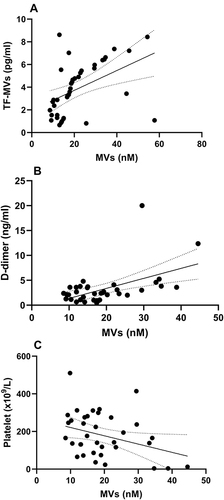
Table 5 Correlation of Microvesicles with the Studied Parameters in COVID-19 Patient Group. Statistical Analysis Was Performed Using the Single-Sample t-test for Correlation Coefficients Between the Microvesicles with Each Parameter in the Table. P < 0.05 Considered Statistically Significant
Figure 2 Scatter plot between microvesicles and (A) tissue factor-bearing microvesicles, (B) D-dimer levels and (C) platelet count.