
Figures & data
Table 1 Specific Treatment Protocol for H. pylori Infection of the Gastric Mucosa
Table 2 The Relationship Between the Age of Onset and Gender in the Occurrence and Development of Atrophic Lesions Due to Hp Infection in the Gastric Mucosa
Figure 1 A flow chart: occurrence and development of mucosal atrophy caused by Hp infection in gastric mucosa.
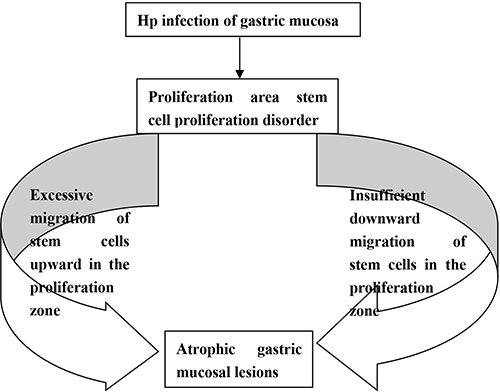
Figure 2 Degeneration of the surface epithelial cells on the gastric mucosa in the presence of Hp infection. (A) Massive adherence of Hp on the mucus layer and surface epithelial cells covered by the gastric mucosal surface epithelium; H&E staining, × 400. (B) A characteristic Hp infection band was visible on the routine pathological section under low magnification; H&E staining, ×10. (C) Cobweb-like vacuolar degeneration of the cytoplasm of the surface epithelial cells. With different degrees of cytoplasmic destruction and detachment, a small amount of cytoplasm remained around the nucleus in a radial structure; finally, the nucleus also degenerated and detached; H&E staining, ×400. (D) Positive for Hp, EnVision method, ×400.
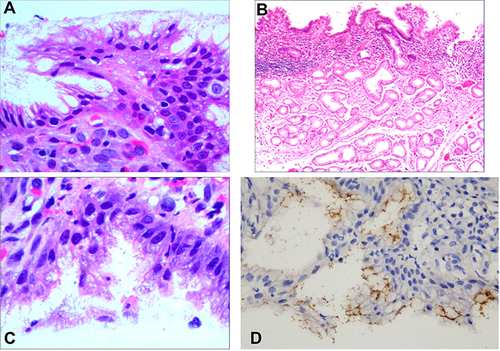
Figure 3 Proliferative disorder of the stem cells in the proliferative region. (A) The hyperplastic glands were mildly enlarged, with poorly defined cytoplasm, increased basophilia, and diffused acute and chronic inflammation of the interstitium; H&E staining, ×100. (B) The nuclei were elongated, mildly to moderately heterogeneous, with increased nuclear chromatin and small-to-medium-sized nucleoli in approximately 20% to 30% of the nuclei; H&E staining, ×200. (C) Positive for Hp, EnVision method, ×100. (D) Formation of the tubular and branched structures by significant cell proliferation in the deep gastric pit and isthmus of the gastric glands, as well as in the proliferating areas of the upper part of the glandular cervix. The proliferating glands were surface epithelial cells with the positive expression of MUC5AC; EnVision method, ×200.
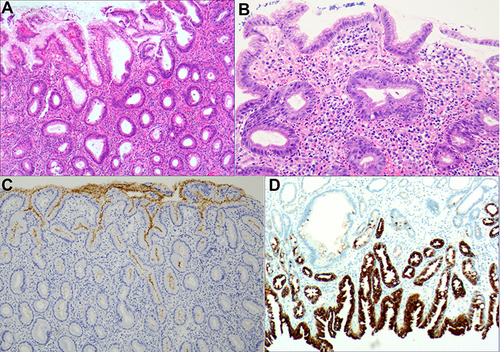
Figure 4 Excessive upward migration of the stem cells in the proliferative region. (A) Massive propagation of cells in the proliferating region resulted in the formation of a histologically characteristic papilloma-like structure; H&E staining, ×100. (B) Enlarged nuclei, one-to-two times the size of the nuclei in the normal surface epithelial cells, with mild to moderate heterotypy; H&E staining, ×400. (C) Positive for MUC5AC, EnVision method, ×200. (D) Positive for CDX2, EnVision method, ×100.
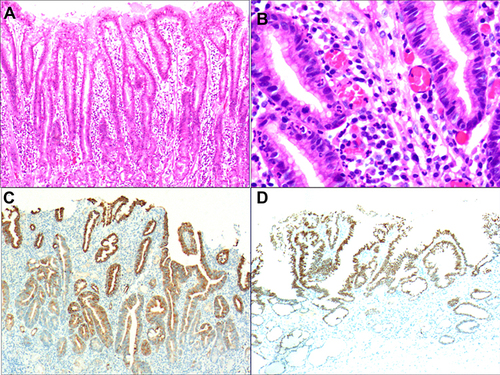
Figure 5 Insufficient downward migration of the stem cells in the proliferative region. (A) Proliferative disorder of the proliferative region, reduction in the number and size of glands in the lamina propria; H&E staining, ×200. (B) Almost complete disappearance of the glands in areas with severe atrophy, with only a thin layer of surface mucus cells, hyperplasia of the fibrous connective and smooth muscle tissue, and hyperplasia of lymphoid tissue; H&E staining, ×100. (C) Positive for MUC6, EnVision method, ×200. (D) Positive for p53, EnVision method, ×200.
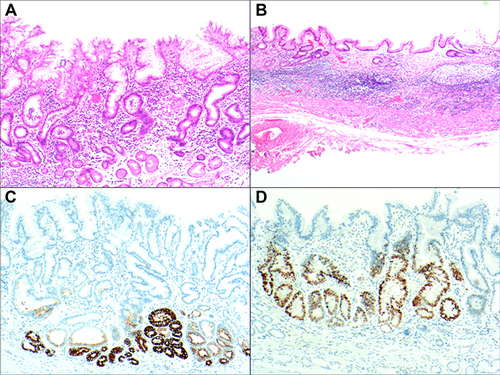
Figure 6 Formation of the characteristic wave-like shape due to extensive atrophy of the intrinsic laminar glands. (A) The widespread segmental papillary hyperplasia and atrophy of the gastric mucosa manifested as relatively regular alternating highs and lows, similar to the undulating waves of an ocean; accordingly, this was labeled the characteristic wave-like shape of Hp infection; H&E staining, ×100. (B) Widespread segmental hyperplasia areas retaining mild to moderate heterogeneity; H&E staining, ×200. (C) Areas of extensive segmental atrophy showing the almost complete disappearance of the fundic glands and only a thin layer of surface mucus cells; H&E staining, ×200. (D) Severe areas with only a thin layer of surface mucus cells; H&E staining, ×200.
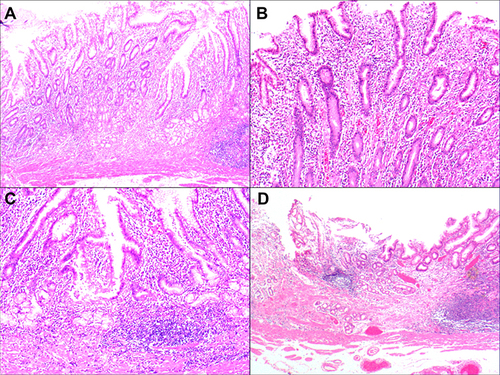
Figure 7 Onset and development of atrophic lesions due to Hp infection in the gastric mucosa and the characteristic histomorphological immunophenotypes.
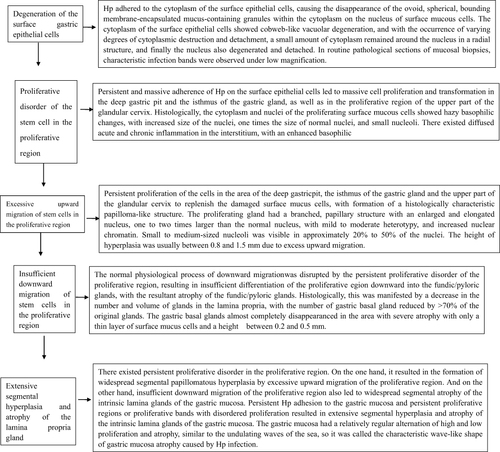
Table 3 Results of Immunohistochemical Staining of Atrophic Lesions of the Gastric Mucosa