Figures & data
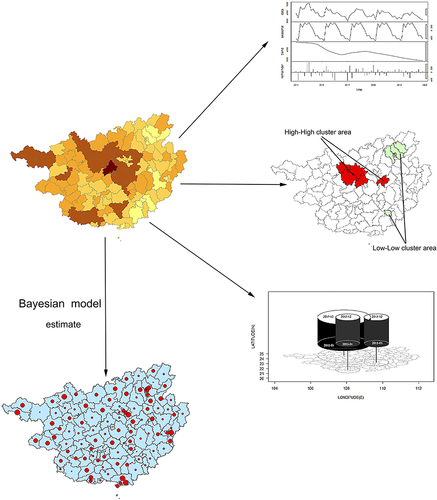
Table 1 Trends in Reported Incidence of Tuberculosis in Guangxi, 2015–2019
Figure 1 Seasonal decomposition analysis TB cases in Guangxi from 2015 to 2019.
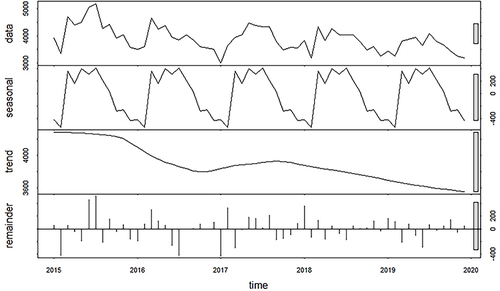
Figure 2 Proportion of occupational composition of TB cases.
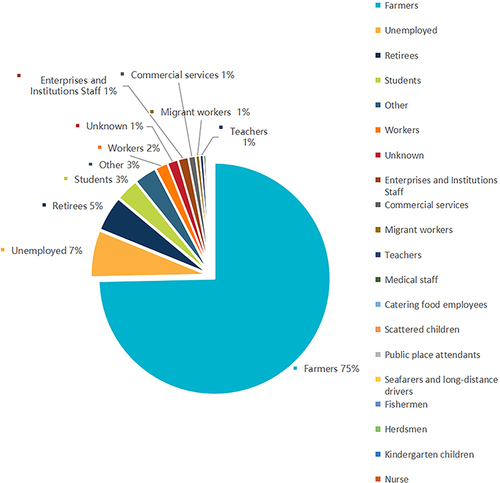
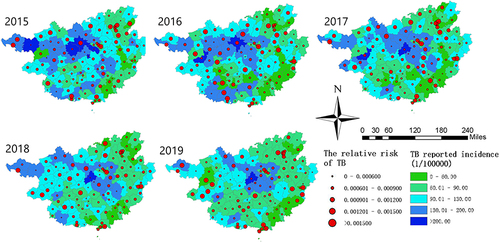
Figure 3 Spatial distribution of the overall reported incidence of TB in Guangxi, 2015–2019 (A), and annual incidence of TB reported by county (B).
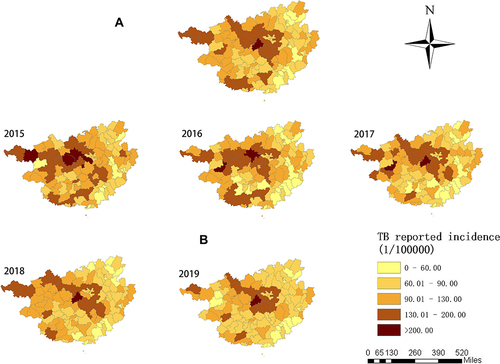
Table 2 The Global Spatial Autocorrelation and Trend in Reported Incidence of TB in Guangxi, 2015–2019
Figure 4 Local spatial autocorrelation of the reported incidence of TB in Guangxi, 2015–2019.
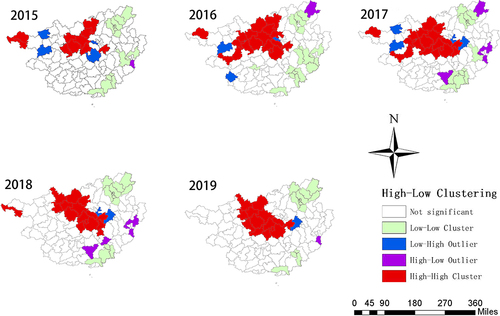
Table 3 Spatial Clustering of TB Cases in Guangxi, 2015–2019
Figure 5 Three-dimensional space-time clustering area, 2015–2019.
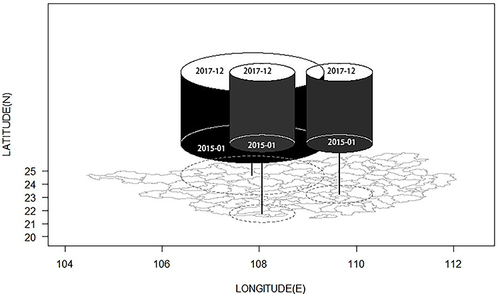
Table 4 Stepwise Regression Model Analysis Was Influencing Factors of Reported TB Incidence in Guangxi from 2015 to 2019
Table 5 Comparison of Goodness of Fit of Four Bayesian Models
Table 6 Bayesian Space-Time Interaction Model Analysis of the Effect of Covariates (β) on TB Risk
Figure 6 Comparison of relative risk and actual reported incidence of TB in Guangxi, 2015–2019.