
Figures & data
Table 1 Demographic Characteristics of Kidney Transplant Recipients and Donors
Table 2 Incidence of Infection at Different Sites During the Perioperative Period of Renal Transplantation
Table 3 Causative Agents of Infection and Treatment Choices
Table 4 Effects of Immunosuppressive Drugs on Infection After Kidney Transplant
Table 5 Effects of Laboratory Parameters on Infection After Kidney Transplant
Figure 1 Comparison of blood routine indexes between non-infected and infected groups.
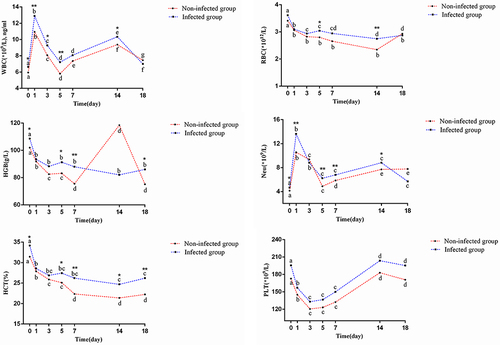
Figure 2 Comparison of liver function between non-infected and infected groups.
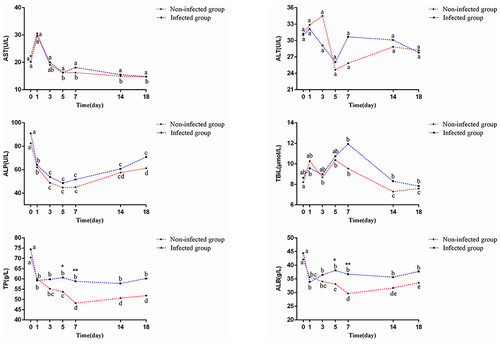
Figure 3 Comparison of renal function between non-infected and infected groups.
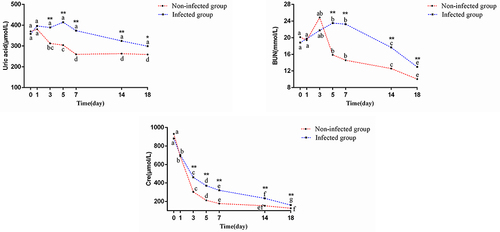
Figure 4 Comparison of CRP and PCT between non-infected and infected groups.
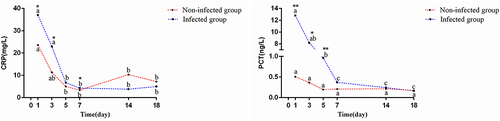
Table 6 Pharmacogenetics Analysis of Non-Infected and Infected Groups
Table 7 Logistic Regression Analysis of Risk Factors Associated with Infection in Kidney Transplant Recipients
Table 8 Comparison of Adverse Reactions Between Non-Infected and Infected Groups