Figures & data
Figure 1 Conceptual framework of the used methodology.
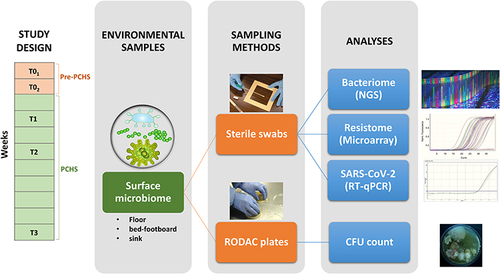
Figure 2 CFU counting on RODAC plates obtained after appropriate incubation. Representative pictures of the results obtained at T0 (pre-PCHS period) and at T1 (2 weeks after PCHS implementation), on PCA (Plate Count Agar; total count), Sabouraud agar (mycetes), Baird–Parker agar (Staphylococcus spp.), and BEA (Bile Esculin Agar, Enterococcus spp.). The number of CFU/plate and the correspondent number of CFU/m2 are indicated.
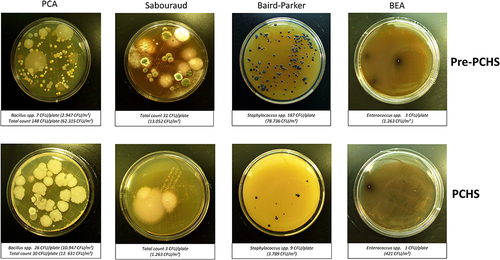
Figure 3 Microbial contamination in emergency rooms in the pre-PCHS and PCHS periods. Results of conventional culture-based analyses (CFU counts). (A) Contamination at T0 (pre-PCHS period); (B) contamination at T1 (2 weeks after PCHS introduction); (C) contamination at T2 (5 weeks after PCHS introduction); (D) contamination at T3 (9 weeks after PCHS introduction). Total CFUs grown on TSA general medium, total pathogens (corresponding to the sum of the individual pathogens enumerated on the specific selective media), and individual pathogens (corresponding to CFUs enumerated on each selective medium) are reported. The results are expressed as median value of CFU/m2 ± S.D.
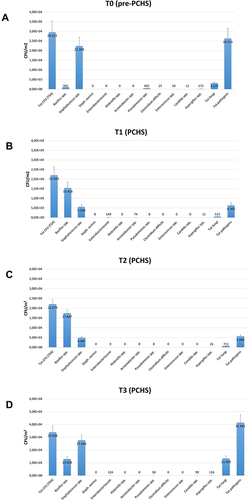
Figure 4 Pathogen contamination and PCHS-derived Bacillus amount in the pre-PCHS and PCHS periods on different surfaces. Results of conventional culture-based analyses (CFU counts). (A) Pathogen cumulative amount on floor, sink and bed footboard before (T0) and after PCHS implementation (T1, T2, T3); (B) PCHS-derived Bacillus amount detected on floor, sink and bed footboard surfaces before (T0) and after PCHS implementation (T1, T2, T3). The results are expressed as median value of CFU/m2 ± S.D.
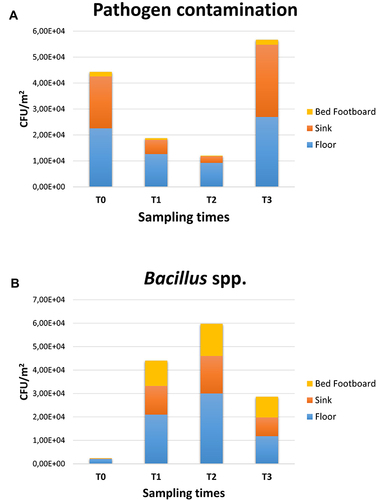
Figure 5 Emergency disinfection interventions performed with 5% NaClO during the PCHS period. The number of weeks after PCHS introduction is indicated in black; the number of NaClO disinfection interventions per week is indicated in red.
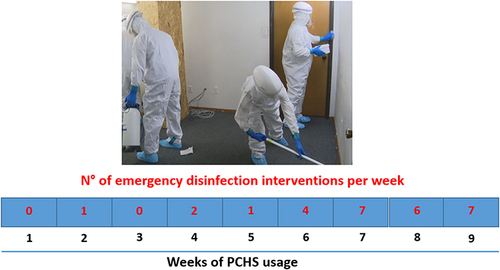
Figure 6 The predominant bacterial communities on tested ER surfaces. Results of NGS analysis performed at T0 (pre-PCHS period) and at T1, T2, and T3 after PCHS introduction. Data are expressed as mean relative abundance values.
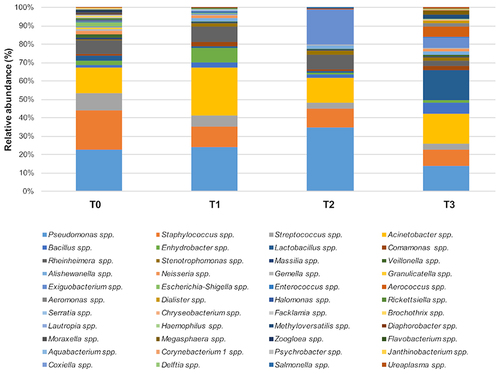
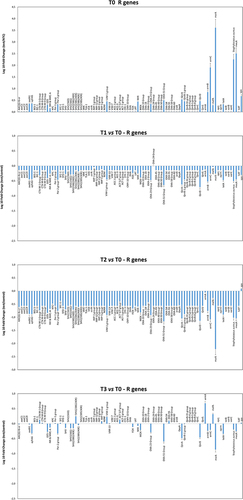
Figure 7 Characterization of the resistome of the ER microbiome before and after PCHS introduction. Results of qPCR microarray analysis performed in duplicate samples collected at T0 (pre-PCHS period) and at T1, T2, and T3 after PCHS introduction. Results are expressed as mean value of Log10 fold change compared to controls ± S.D, for each indicated resistance gene.