Figures & data
Table 1 The MIC Value of Berberine Among Different MLST Types of MRSA
Table 2 MIC and FIC Index of CLI and RIF in the Presence of BER Against MRSA Strains
Table 3 The Antibacterial Activity of BER in Combination with CLI and RIF Against MRSA Strains (%, n/N)
Figure 1 The time-killing curves for BER alone and in combination with RIF or CLI against MRSA strains; (A–C): Control (D–F): ST239. The data are the mean ±SD of colony counts at least two biological replicates in each group.
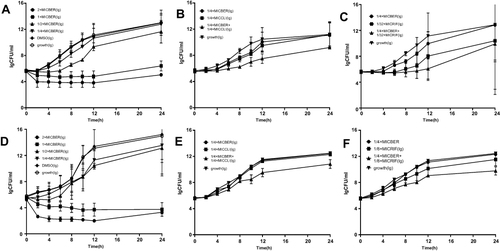
Table 4 The Percentage of Biofilm Formation Inhibited
Figure 2 The effects of BER alone on biofilm formation of MRSA strains. (A) Control (B) ST 239; relative biofilm formation levels were represented as mean±SD of at least two biological replicates; significant difference was determined at P < 0.0001 with comparison between the groups.
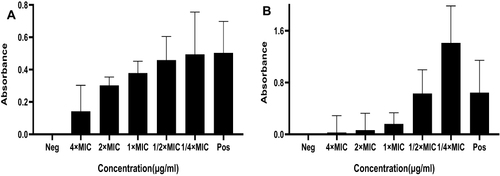
Figure 3 The effects of BER in combination with RIF or CLI on biofilm formation of MRSA strains. (A and B): Control (C and D): ST 239; relative biofilm formation levels were represented as mean±SD of at least two biological replicates; significant difference was determined at P < 0.0001 with comparison between the groups.
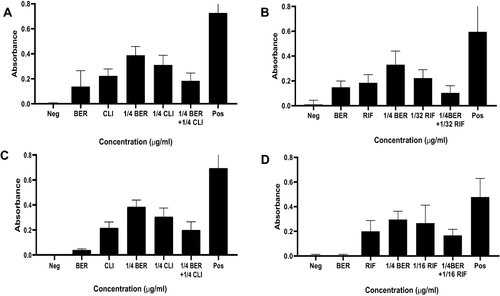
Figure 4 The effect of BER on cell membrane integrity of MRSA strain by confocal laser scanning microscopy.
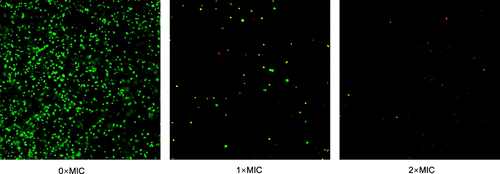
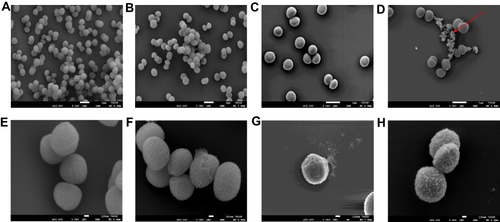
Figure 5 The changes in the morphology of MRSA cells with BER by field emission scanning electron microscope. (A and E): 0×MIC; (B and F): 1×MIC; (C and G): 2×MIC; (D and H): 4×MIC. Shown by the arrow is flocculent substances.