Figures & data
Figure 1 Cost per megabase of sequencing, from 2001 to 2012.
Adapted from the NIH NHGRI Genome Sequencing Program website (http://www.genome.gov/sequencingcosts/).
Abbreviations: NIH, National Institutes of Health, NHGRI, National Human Genome Research Institute.
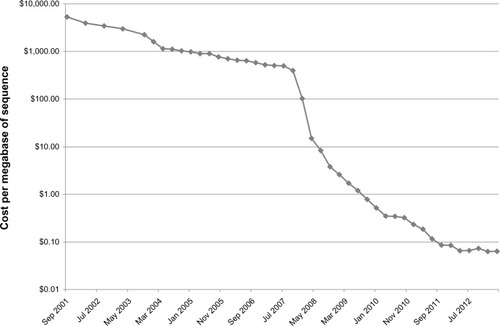
Table 1 An overview of current sequencing technologies
Table 2 Relative strengths and weaknesses of current sequencing technologies