Figures & data
Table 1 Bacterial Strains and Plasmids Used in This Study
Table 2 Primers Used in This Study
Figure 1 Plasmid map of pCas9-oriT and pBAD-Cas9-oriT. (A) Plasmid pCas9-oriT containing Cas9, tracrRNA, crRNA, specific guide RNAs(sgRNA), origin of transfer (oriTRP4) and chloramphenicol resistance gene (CmR). DR: direct repeats (B) The pBAD-Cas9-oriT containing the Cas9, tracrRNA, crRNA, sgRNA, oriTRP4, the arabinose inducing promoter pBAD and CmR.
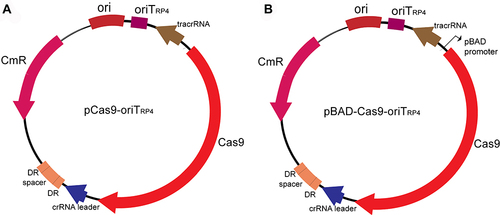
Figure 2 Effect of the pCas9 transformation into E coli harboring different pNDM-5. E. coli 02 bears the plasmid pNDM-5 with IncFII-type. E. coli 03 contains the high copy numbers plasmid pUC19- blaNDM-5. E. coli 04 bears the plasmid pNDM-5 with IncX3-type. Data points represent the mean value of three biological replicates, in which error bars showing the standard deviation.
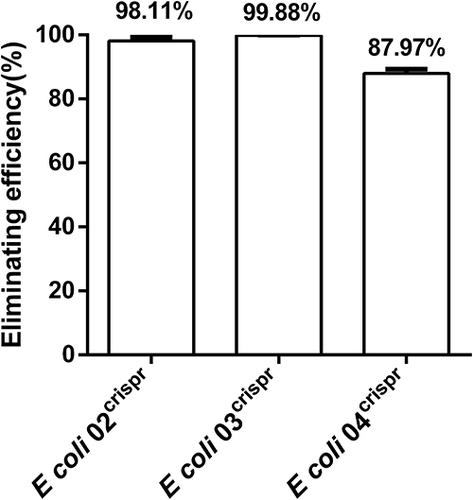
Figure 3 Relative copy number of plasmid pNDM-5 at each time point. pCas9-N transformed into competent E. coli 02 served as the experimental groups. Plasmid pCas9 transformed into competent E. coli 02 served as the control group. Data points represent the mean value of three biological replicates, in which the error bars showing the standard deviation.
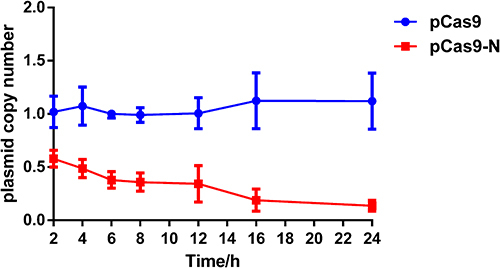
Figure 4 Confirmation of Cas9 and blaNDM-5 gene presence in E. coli 02 by PCR amplification with primer pCas9-F/R and NDM-5-F/R. M indicates the 2000 bp marker. (A) Cas9 was detected in the pCas9-oriT-N; (B) blaNDM-5 was detected in the pCas9-oriT-N.
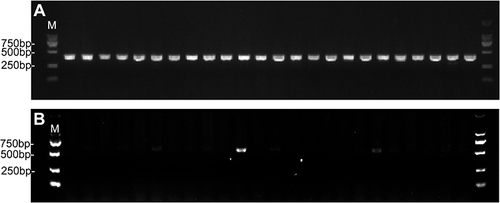
Figure 5 blaNDM-5 elimination efficiency with different arabinose concentrations and incubation time. (A) Elimination efficiency of blaNDM-5 with four different concentrations of arabinose (0.01%, 0.10%, 1.00% and 2.00%) at 6 h of incubation. (B) Elimination efficiencies at induction times of 0, 2, 4, 6, 8 and 16 h with 1.00% arabinose induction. Each experiment was performed in triplicate. Data points represent the mean value of three biological replicates, in which the error bars indicate the standard deviation. *p<0.05, **p<0.01.
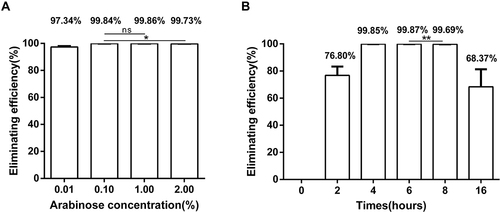
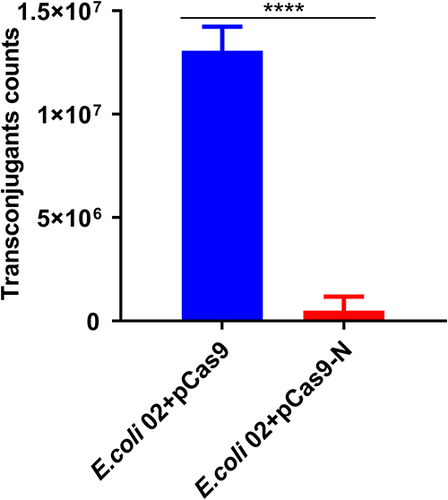
Figure 6 E. coli J53 harboring pCas9-N precluded the conjunctive plasmid pNDM-5. E. coli 02 as donor and E. coli J53+pCas9-N or E. coli J53+pCas9 as the recipient strain. Data points represent the mean value of three biological replicates, in which the error bars showing indicate the standard deviation. ****p<0.0001.