Figures & data
Figure 1 Chest X-ray/computed tomography (CT) findings and detection of the genes of Mycobacterium avium complex by tissue-direct polymerase chain reaction-based nucleic acid lateral flow immunoassay (tdPCR-NALFIA) from lung tissue in patient 1. (A and B) Chest X-ray findings (A) and CT findings (B) of patient 1, respectively. The arrows indicate the abnormal nodules. (C and D): Magnified view of the section stained with hematoxylin-eosin (× 400) and Ziehl–Neelsen (× 1000), respectively. (E and F): Mycobacterium avium complex in the patient’s lung tissue section and tdPCR-NALFIA, respectively. The images show the granulomas (C and E), stained Mycobacterium (D) and the detected band (F), respectively (arrows).
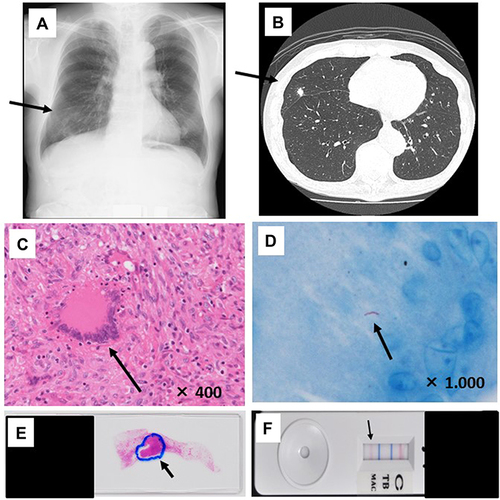
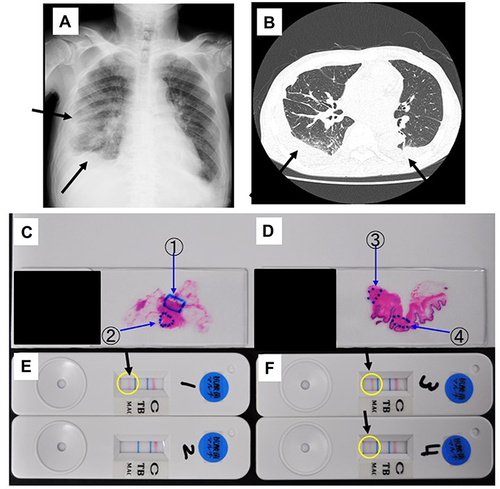
Figure 2 Chest X-ray/ computed tomography (CT) findings and detection of the genes of Mycobacterium avium complex by tissue-direct polymerase chain reaction-based nucleic acid lateral flow immunoassay (tdPCR-NALFIA) from skin tissue in patient 2. (A and B): Chest X-ray findings (A) and CT findings (B) of patient 2, respectively. Arrows indicated infiltration shadows and pleural effusions. (C–F): Mycobacterium avium complex detection in the patient’s skin tissue section and tdPCR-NALFIA, respectively. The images show the granulomas (C and D) and the detected bands (E and F), respectively (arrows). The numbers indicate the selected tissue and the results of tdPCR-NALFIA for each selected tissue.