Figures & data
Table 1 RT-PCR Primer Sequences
Figure 1 The growth of standard bacteria, susceptible and drug-resistant Escherichia coli in the culture medium.
Notes: (A) Right channel: No. 0 strain is a control susceptible Escherichia coli strain; left channel: No. 11 strain is a drug-resistant ESBLs-EC strain, showing several red round masses. (B) ATCC25922 is the control standard strain.
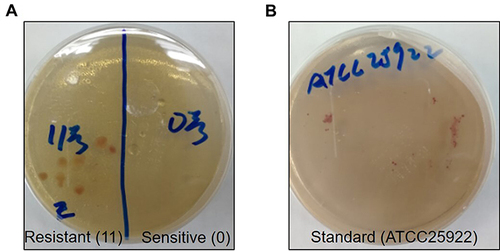
Figure 2 Sequencing results of the whole genome map of drug-resistant bacteria.
Notes: (A) Histogram of GO annotation distribution. These genes belong to each of three categories of Biological Process, Cellular Component, and Molecular Function term. The horizontal axis is the secondary classification of GO, and the vertical axis is the percentage of genes (left). Different colors represent different orthologs. (B) Histogram of KEGG pathway classification. The vertical axis is the name of the involved metabolic pathway, and the X axis is the number of genes annotated to the pathway. (C) The statistical histogram of CAZy functional classification. The horizontal axis is functional classification, and the vertical axis is the number of sequences. (D) Bar graph of pathogen–host interaction based on PHI phenotype summary. The vertical axis represents 9 different phenotypes of pathogen–host interaction, and the vertical axis is the number of genes. (E) Pie graph of prediction results of protein subcellular localization.
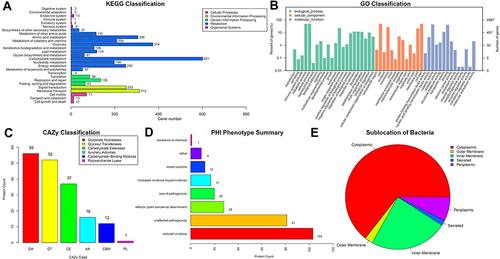
Figure 3 Relative gene expression of different types of bacteria (using 16s as the internal reference).
Note: ATCC is the standard bacteria, No. 0 strain is susceptible Escherichia coli, and No. 11 is ESBLs-EC.
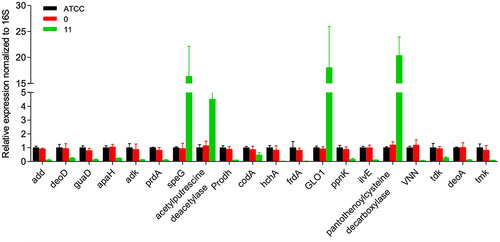
Figure 4 Verification of Glo1 gene knockout and overexpression in bacteria strain.
Notes: (A) Construction of targeting fragments by fusion PCR technology (M: DNA molecular weight standard. The molecular weights from top to bottom are: 10,000, 8000, 6000, 5000, 4000, 3000, 2500, 2000, 1500, 1000, 800, 600, 400, 200 bp, among which 1000bp is highlighted). The length of targeting sequence is 2291bp. (B) PCR identification of outer primers of GLO1 knockout flora gene, and the same DNA molecular weight standard was used. No. 1–14: Amplification results of the outer primers of clone 1–14; No. 15: amplification result of original strain; No. 16: amplification result of negative control without template. (C) Monoclonal bacterial solution inoculated with cloning bacterial solution No. 1 was verified with outer primers. Lane 1: the amplification result of the outer primer of the bacterial solution; lane 2: the amplification result of the original strain; lane 3: the amplification result of the negative control without template. (D) DNA results of GLO1 overexpression plasmid (expected fragment 417+3.4K).
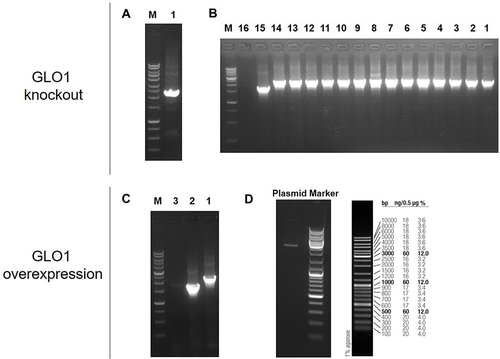
Figure 5 Determination of β-lactamase content in bacteria by ELISA.
Notes: (A) Detection of CTX type of β-lactamase. (B) Detection of PER type of β-lactamase. (C) Detection of TEM type of β-lactamase. (D) Detection of BES type of β-lactamase. (E) Detection of OAX type of β-lactamase. (F) Detection of SHV type of β-lactamase. (G) Detection of VEB type of β-lactamase. 11-KO: ESBLs-EC with knockout of GLO1; 11-KO-CMV: GLO1-deficient ESBLs-EC with transfection of GLO1-overexpressing plasmid; 11-KO-NC: GLO1-deficient ESBLs-EC transfected with blank overexpression plasmid; ATCC-CMV: standard bacteria transfected with blank overexpression plasmid; ATCC-NC: standard bacteria with GLO1 overexpression; 0-CMV: susceptible Escherichia coli with GLO1 overexpression; 0-NC: blank overexpression control bacteria. *P < 0.05.
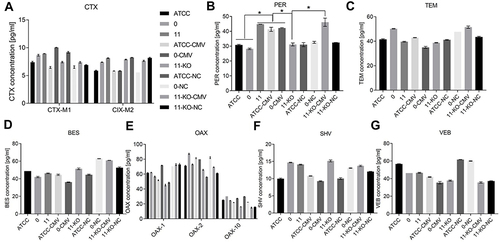
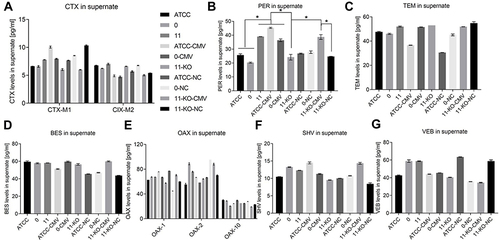
Figure 6 Determination of β-lactamase content in supernatant by ELISA.
Notes: (A) Detection of CTX type of β-lactamase. (B) Detection of PER type of β-lactamase. (C) Detection of TEM type of β-lactamase. (D) Detection of BES type of β-lactamase. (E) Detection of OAX type of β-lactamase. (F) Detection of SHV type of β-lactamase. (G) Detection of VEB type of β-lactamase. *P < 0.05.