Figures & data
Figure 1 Population distribution and geographic distribution of all known Klebsiella michiganensis strains with complete genomes. (A) Geographic locations of 32 K. michiganensis strains in the world. The dots in the figure are used to mark the geographic distribution of strains. If the number of strains distributed in countries except China was greater than one, one dot is used to represent. Strains located in China are represented by smaller dots due to their dense distribution. The black dots represent the K. michiganensis strains that did not carry IncHI5 plasmids, the orange dots represent the K. michiganensis strains carrying IncHI5 plasmids, and the red star represents the K. michiganensis strain carrying pK92-qnrS from this study. (B) Maximum-likelihood tree. The degree of support (percentage) for each cluster of associated taxa, as determined by bootstrap analysis, is shown with blue dots next to each branch. The bar corresponds to the scale of sequence divergence. The meaning of the symbols corresponds to that in (A). (C) Geographic locations of K. michiganensis strains in China. The meanings of the symbols correspondto those in (A).
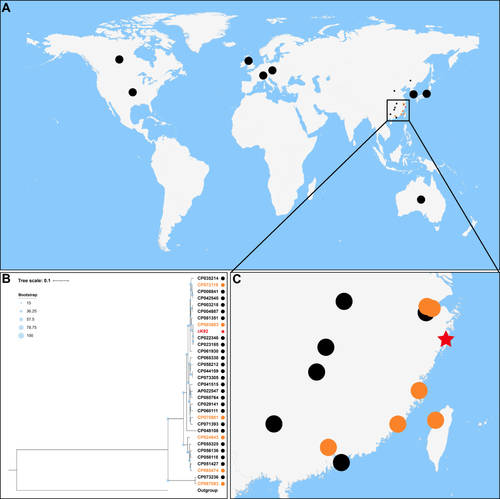
Table 1 Major Features of IncHI5 Plasmids Carried by Klebsiella michiganensis Included in This Study
Figure 2 Maximum-likelihood tree and heatmap of prevalence of resistance genes in the seven plasmids. Bootstrap is shown with blue dots next to each branch. The bar corresponds to the scale of sequence divergence.
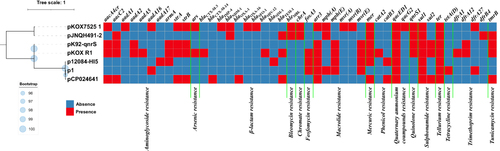
Figure 3 Nine Tn1696-related regions from the seven plasmids. Genes are denoted by arrows. Genes, mobile genetic elements and other features are colored based on their functional classification. Shading denotes regions of homology (nucleotide identity > 95%). The accession numbers of Tn1696Citation35,Citation36 and Tn1548Citation37 for reference are U12338 and AF550415, respectively.
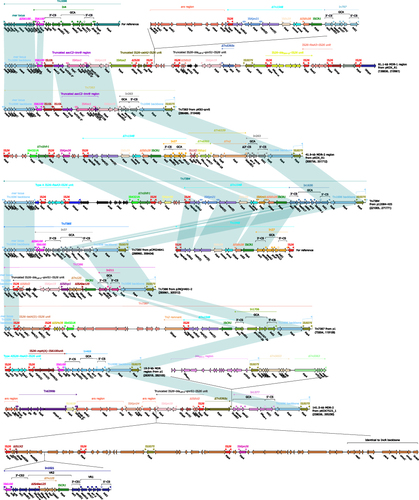
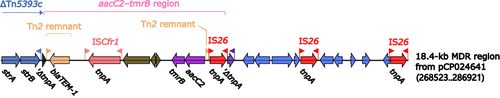
Figure 4 Tn6535-related regions from pK92-qnrS, pJNQH491-2, and pKOX7525_1. Genes are denoted by arrows. Genes, mobile genetic elements and other features are colored based on their functional classification. Shading denoted regions of homology (nucleotide identity > 95%). The accession numbers of Tn6535Citation38 and Tn1548Citation37 for reference are CP009706 and AF550415, respectively.
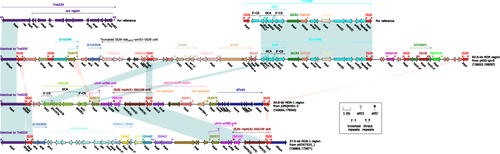
Figure 5 18.4-kb MDR region from pCP024641. Genes are denoted by arrows. Genes, mobile genetic elements and other features are colored based on their functional classification.