
Figures & data
Table 1 Clinical Characteristics of the Study Cohort
Figure 1 Plasma sPD-1 at different time points after NA treatment discontinuation. Plasma sPD-1 levels were measured from the end-of-treatment to week 48 or the clinical relapse time. Stratification of patients according to whether clinical relapse occurred or not.*p < 0.05 for the comparison of sustained response vs clinical relapse. Data are presented as compared between groups by Mann–Whitney U-test.
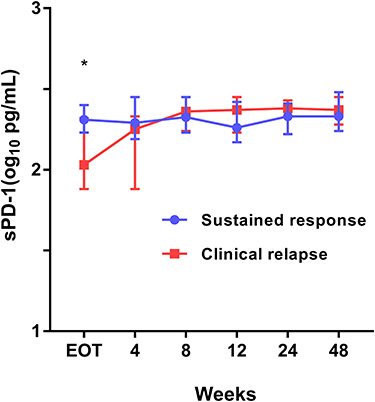
Figure 2 ROC curves of sPD-1 and it’s cut-off value to predict clinical relapse after discontinuation of NA therapy. (A) The AUROCs of EOT sPD-1 for clinical relapse at 2, 4, 6 and 8 year after NAs discontinuation were 0.71 (95% CI, 0.61–0.82), 0.67 (95% CI, 0.56–0.78), 0.64 (95% CI, 0.53–0.75) and 0.65 (95% CI, 0.54–0.76), respectively. (B) At EOT, 67 (58.3%) patients had undetectable sPD-1. The cumulative clinical relapse rates patients with detectable and undetectable sPD-1 levels were 48% and 67.7%, respectively, (Log rank test: p = 0.002).
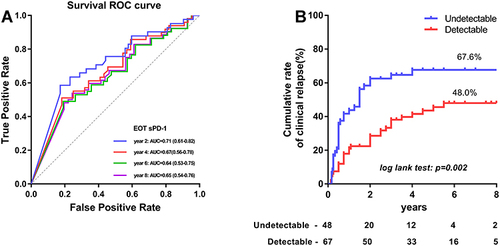
Table 2 Cox Proportional Hazard Model for Clinical Relapse (n=115)
Table 3 Cox Proportional Hazard Model for HBsAg Loss (n=115)
Figure 3 Cumulative rates of HBsAg loss and ROC curves in patients with different levels of HBsAg and sPD-1. (A) The EOT HBsAg level < 100 IU/mL (n=23) and ≥ 100 IU/mL (n=92) contributed 66.2% and 15.1% 8-year cumulative rates of HBsAg loss, respectively (Log rank test: p < 0.001). (B) The EOT undetectable and detectable sPD-1 levels exhibited 2.4% and 33.7% cumulative rates of HBsAg loss (Log rank test: p = 0.01). (C) The AUROCs of HBsAg < 100 IU/mL and detectable sPD-1 for HBsAg loss were 0.71 and 0.70, respectively.
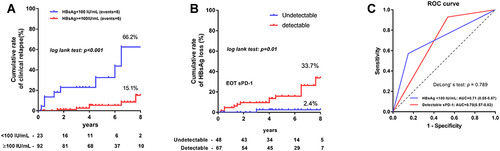
Table 4 Spearman Correlation Between sPD-1 Level and ALT, HBsAg, HBV DNA at the End of Treatment and After Treatment Discontinuation