
Figures & data
Table 1 Table Showing the Primers Used
Figure 1 Petri dish with a strain of E. coli resistant to CRO, CAZ, CTX, ATM.
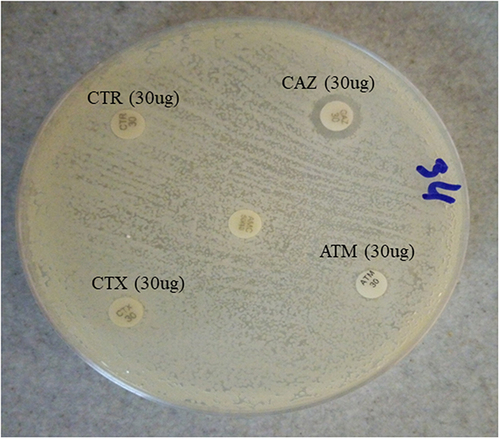
Table 2 Distribution of Bacterial Species According to the Gender of the Patients
Table 3 Distribution of Bacterial Species According to the Age of the Patients
Table 4 Distribution of Bacterial Species According to the Patient’s Pathological Products
Table 5 Distribution of Bacterial Species According to Susceptibility to Oxyimino-Cephalosporin
Table 6 Distribution of Bacterial Species According to Patient Gender and Resistance to Oxyimino-Cephalosporin
Table 7 Distribution of Bacterial Species According to Patient Age and Oxyimino Cephalosporin Resistance
Table 8 Distribution of Oxyimino Cephalosporin Resistance of the Two Bacterial Species According to Sample Type
Figure 2 Agarose gel with the GES gene. M = Molecular weight marker, numbers 1: 1 = Positive control; 2 = Negative control; 3 = GES gene; 4 = Vaginal swab, the red circle indicates the position of the GES gene bands. The meaning of Electrophoresis migration is from top to bottom.
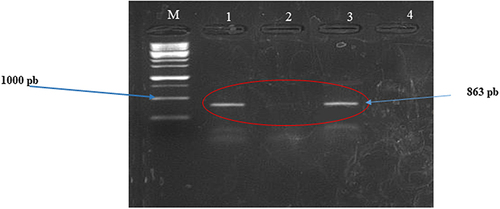
Table 9 Distribution of the Two Bacterial Species According to the Presence of the GES Gene
Table 10 Distribution of the GES Gene According to the Sex of the Patients
Table 11 Distribution of the GES Gene According to the Sex and Age of the Patients
Table 12 Distribution of the GES Resistance Gene According to the Type of Sample