
Figures & data
Figure 1 Bone marrow smear showed (A) Actively hypercellular marrow with reduced erythropoiesis; Wright-Giemsa Stain, magnification 100x; (B) Vacuolated pronormoblasts; Wright-Giemsa Stain, magnification 400x.
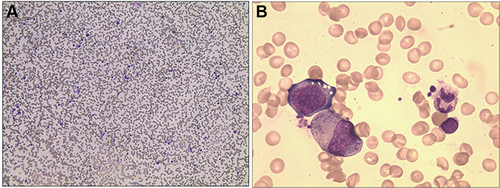
Figure 2 FDG-PET-CT image showing abnormal 18F-flurodeoxyglucose uptake in and around the popliteal artery stent region, suggestive of an active infective. There is possible abscess formation around the left stent.
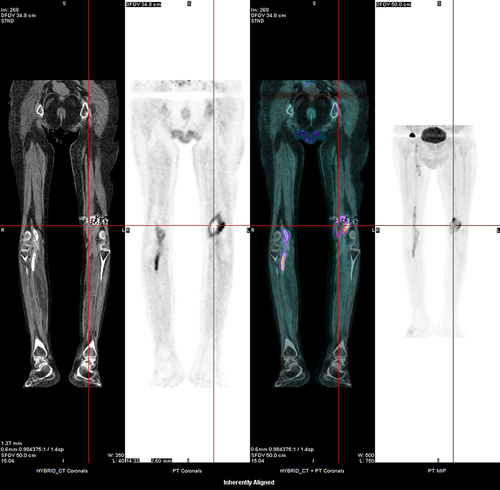
Figure 3 Hemoglobin and platelet variation detected by complete blood count monitor. (D1 is the first day of first-time LZD-treatment). Multiple antimicrobials were given to the patient before and after LZD therapy was initiated. Blue bars show periods of administration of antibiotics.
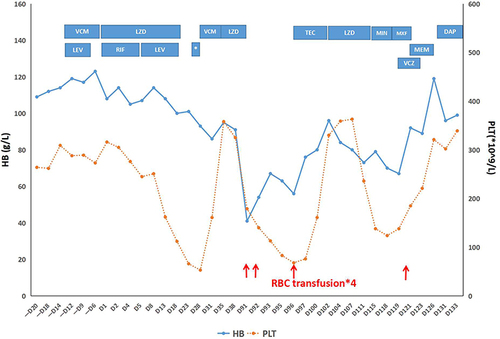
Table 1 Previous Reports and Our Case of Linezolid-Induced PRCA
Table 2 Treatment and Recovery Time of Anemia for LZD-Induced PRCA