Figures & data
Figure 1 Cytotoxicity concentration 50 (CC50) and infectivity concentration 50(IC50) of the three mushrooms P. ostreatus, L. edodes and A. bisporus.
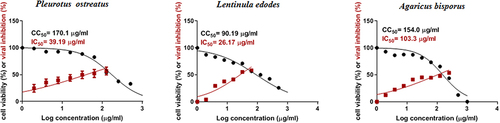
Table 1 The CDOKER Interaction Energy of the Small Molecule Ligands
Table 2 Main H-Bond & Electrostatic Interactions Between Mushroom Tyrosinase (2Y9X) and Mpro of COVID-19 (6XQU) Using ZDOCK Algorithm
Table 3 Main H-Bond Interactions Between Superoxide Dismutase (1BO6) and Mpro of COVID-19 (6XQU)
Table 4 Main H-Bond Interactions Between Catalase (1DGG) and Mpro of COVID-19 (6XQU)
Figure 2 Top pose in largest z-ranked clustering of mushroom tyrosinase (ribbon shaped) (2Y9X) from A. bisporus with Mpro of COVID-19 (6XQU) (line shaped).
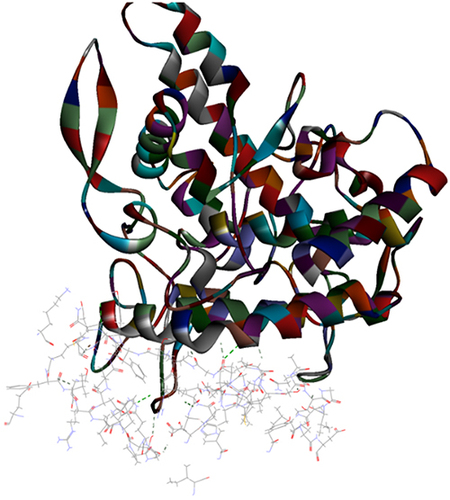
Figure 3 Top pose in largest z-ranked clustering of superoxide dismutase (ribbon shaped) (1BO6) from P. ostreatus, L. edodes and A. bisporus with Mpro of COVID-19 (6XQU) (line shaped).
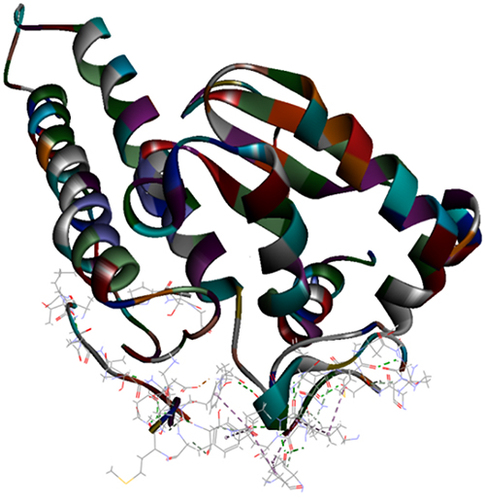
Figure 4 Top pose in largest z-ranked clustering of catalase (1DGG) from P. ostreatus, L. edodes and A. bisporus with Mpro of COVID-19 (6XQU) (line shaped).
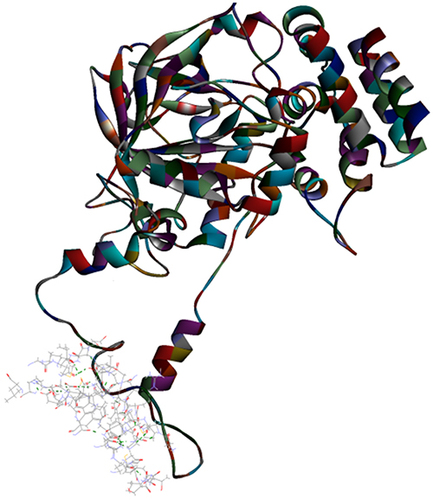
Table 5 ZDOCK Results for the Different Ligand Proteins
Figure 5 Top pose in largest z-ranked clustering of (A) Ubiquitin like protein (ribbon shaped) (1BT0) from P. ostreatus, L. edodes and A. bisporus. (B) Valosin (2X8A) from L. edodes with Mpro of COVID-19 (6XQU) (line shaped).
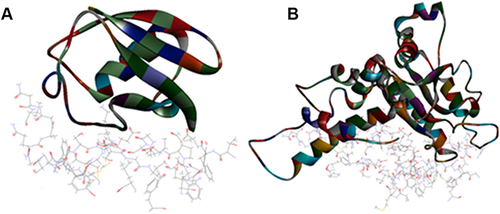
Figure 6 Total energy versus time dynamics plot for (A) Mpro of COVID-19 (6XQU), (B) Mushroom tyrosinase (2Y9X), (C) undocked catechin and (D) Catechin complexed with 6XQU after docking.
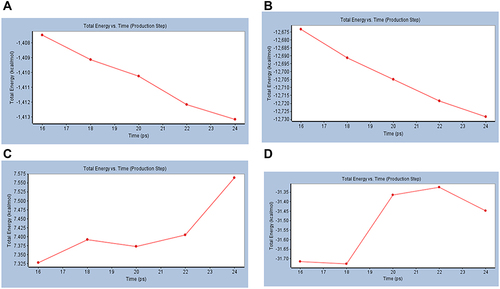
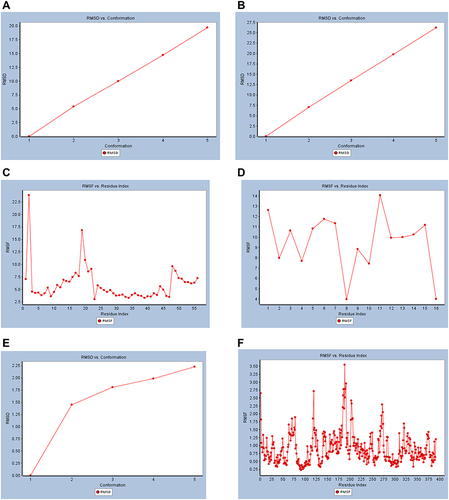
Figure 7 Dynamic simulation of (A) RMSD plot of Mpro of COVID-19 (6XQU) before docking, (B) RMSD plot of (6XQU) after catechin docking, (C) RMSF plot of 6QXU before docking, (D) RMSF plot of 6QXU after catechin docking, (E) RMSD plot of mushroom tyrosinase (2Y9X), and (F) RMSF plot of mushroom tyrosinase (2Y9X).