
Figures & data
Figure 1 The flowchart of cohort selection.
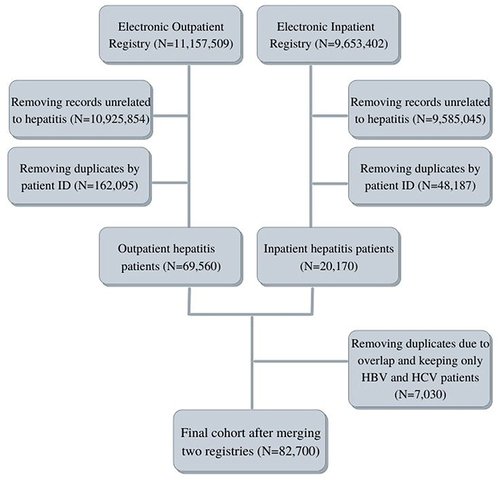
Table 1 General Characteristics of Patients Subdivided by Hepatitis Type
Figure 2 Prevalence, incidence, and mortality of HBV patients ((A) – crude rates per 100,000 population, (C) – absolute numbers) and HCV patients ((B) – crude rates per 100,000 population, (D) – absolute numbers).
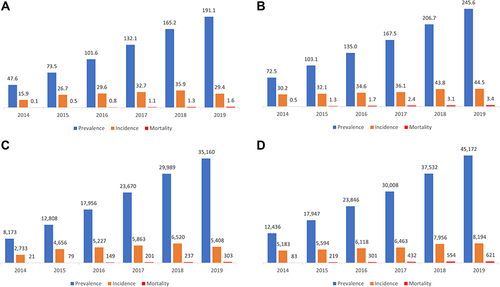
Figure 3 Incidence rates of HBV and HCV per 100,000 population over 2014–2019 ((A) – crude year- and sex-specific, (B) – crude age- and sex-specific).
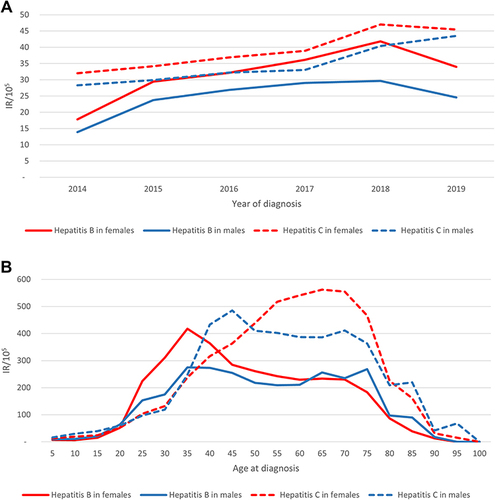
Figure 4 Mortality rates of HBV and HCV per 100,000 population over 2014–2019 ((A) – crude year- and sex-specific, (B) – crude age- and sex-specific).
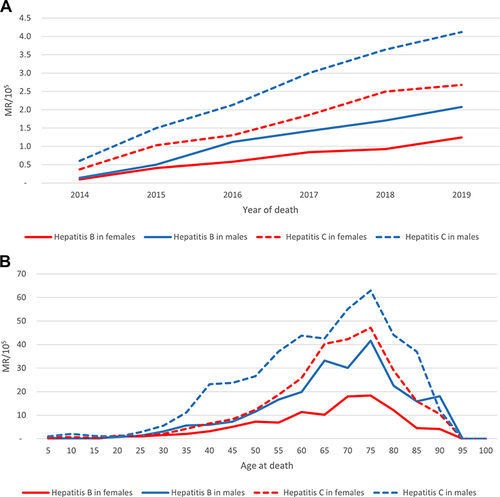
Table 2 General Characteristics of Patients Subdivided by Presence of Cirrhosis and Hepatocellular Carcinoma
Table 3 Death Counts and Mortality Rates per 1000 Person-Years Stratified by Hepatitis Type
Figure 5 Mortality estimates in HBV patients ((A) – based on sex, (C) – based on ethnicity), and in HCV patients ((B) – based on sex, (D) – based on ethnicity).
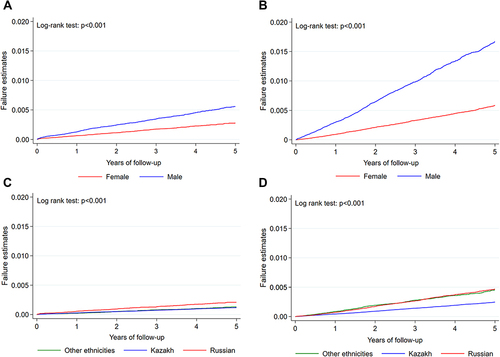
Table 4 Adjusted and Unadjusted Hazard Ratios with 95% Confidence Intervals for All-Cause Mortality Among Hepatitis Patients