Figures & data
Table 1 The Positivity Rate of Enteric Virus by Demographic and Clinical Characteristics of the Study Participants
Table 2 Genotypic Distribution of Enteric Viruses in Under-Five Children with Diarrhea
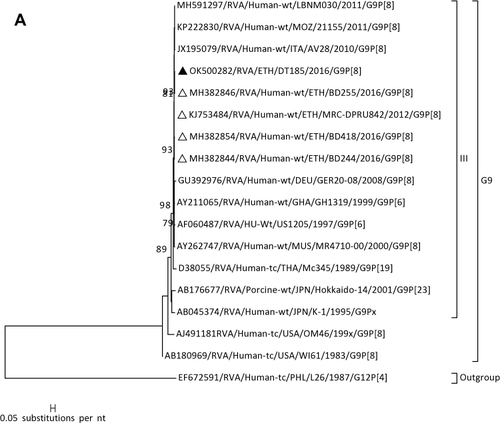
Figure 1 Continued.
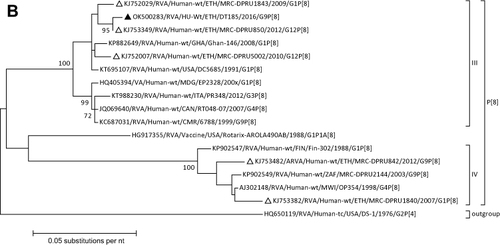
Figure 1 Continued.
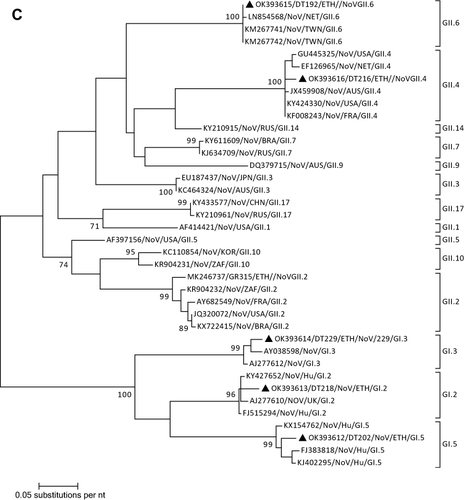
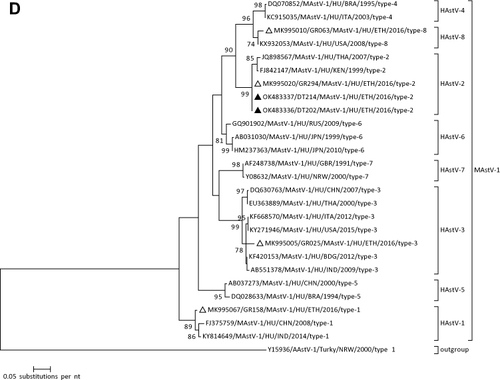
Figure 1 Continued.
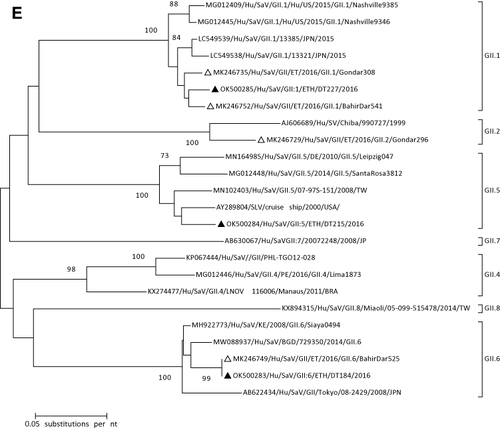
Figure 1 Continued.
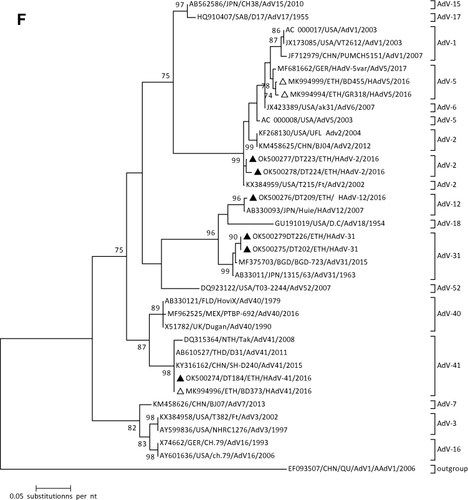
Figure 1 Continued.
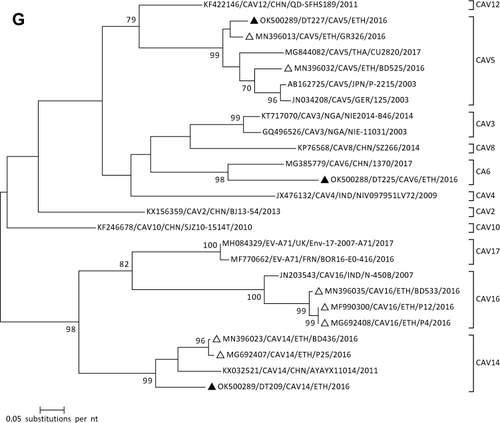
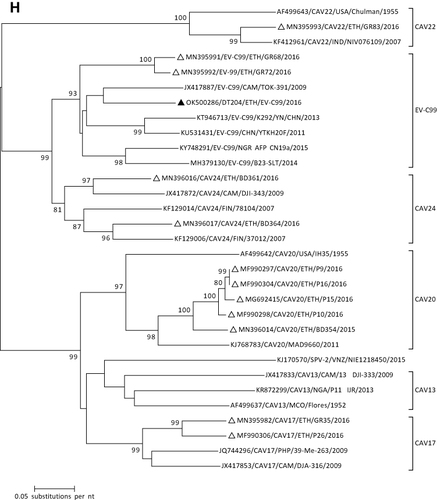
Figure 1 Phylogenetic analysis of RVA (A and B), NoV (C), HAstV (D), SaV (E), HAdV (F), EVA (G) and EVC (H). A portion the VP7 and VP4 regions were used for RVA. Partial sequences of hexon loop one and ORF2 were used for HAdV and HAstV, respectively. Portions of the VP1 coding regions were used for NoV, SaV and EV. The trees were constructed by using Maximum-likelihood (ML) method with a bootstrap analysis of 1000. Strains from the present study are labeled with black triangles and white triangles indicate previously reported strains from Ethiopia.