Figures & data
Figure 1 Timeline of the patient’s clinical manifestations and treatment.
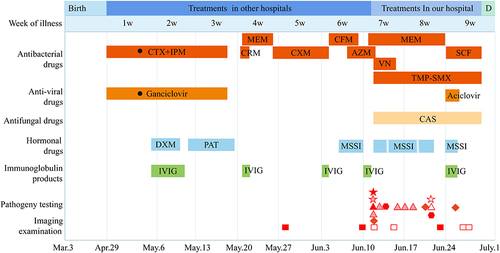
Figure 2 Imaging data of lungs. (A) on the 1st day of admission, CR showed exudation in both lungs and large effusion in the right pleural cavity. (B) CR indicated a large amount of diffuse patchy exudation in both lung fields on the 4th day. (C and D) Chest CT scans showed dense shadow and consolidation were diffused in both lungs on the 12th day. (E and F) on the day before discharge day, CR showed exudation and consolidation still existed in large areas of the lungs.
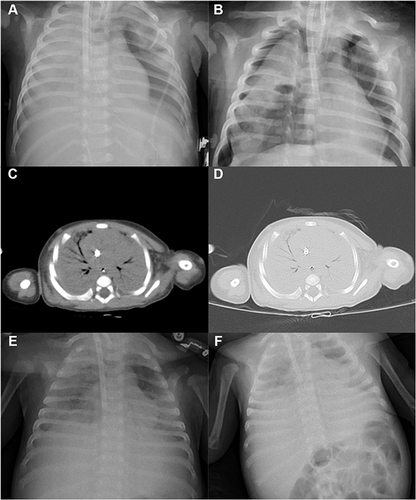
Table 1 The Pathogen and Sequence Reads Detected by mNGS in Different Specimen Types
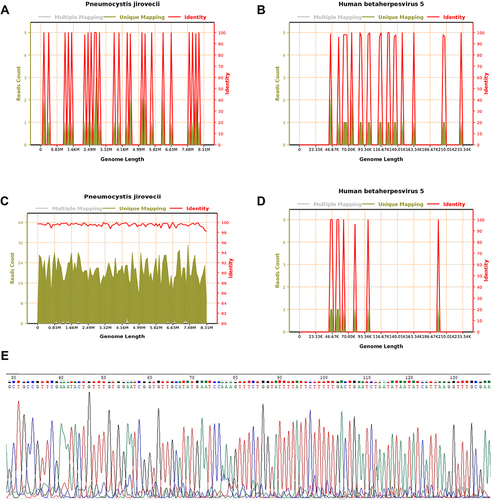
Figure 3 Blood mGNS gene sequence coverage depth map for PJ (A) and CMV (B); sputum mGNS gene sequence coverage depth map for PJ (C) and CMV (D). Multiple Mapping: Multiple comparing 2 or more species. Unique Mapping: unique comparison to a certain species. Identity: the identity of the sequence compared to the reference genome. The abscissa is the size and location of the genome; the ordinate on the left is the number of sequenced sequences of the reference genome; the ordinate on the right is the consistency of the sequenced sequence with the reference genome. Peak map of PJ nucleic acid by Sanger sequencing (E).