
Figures & data
Figure 1 MALDI-TOF MS results of three isolates; green curve was S18010071_S, the blue curve was R17123922_R, and the red curve was R18013231_R.
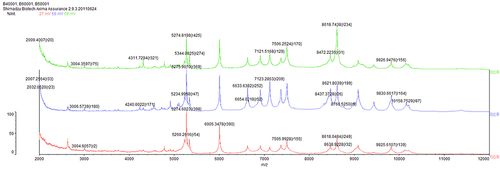
Figure 2 The results of genomic extraction and 16sRNA electrophoresis of three isolates. (A) The results of genomic extraction from three isolates. Lane 1: S18010071_S, Lane 2:R17123922_R, Lane 3:R18013231_R, Lane 4: DNA Marker 10,000. (B) The electrophoretic results of the products amplified by 16srDNA universal primers. Lane 1:S18010071_S; Lane 2:R17123922_R; Lanes 3 and 4: R18013231_R, Lane 5: DNA Marker 10,000.
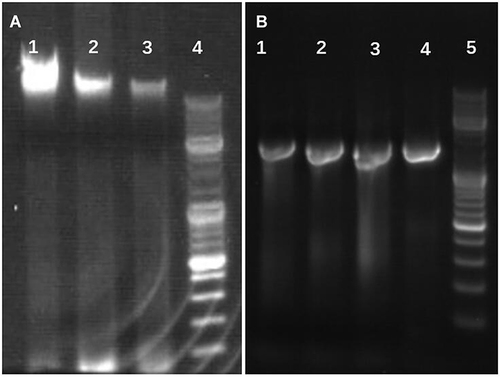
Table 1 The Results of Antimicrobial Susceptibility Testing by Disk Diffusion Method
Table 2 The Results of Antimicrobial Susceptibility Testing by Broth Microdilution Method
Figure 3 Sequencing depth distribution of Moraxella catarrhalis.
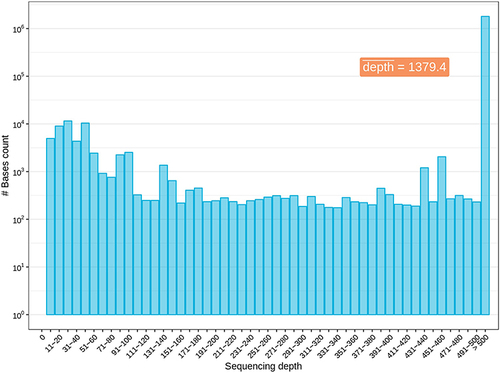
Figure 4 SNV and indel mutations of Moraxella catarrhalis were analyzed by Venn diagram. (A) Results of SNV analysis between two macrolide-resistant Moraxella catarrhalis. (B) Results of indel analysis between two macrolide-resistant Moraxella catarrhalis.
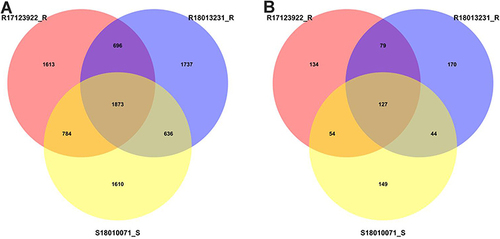
Figure 5 Distribution of SNV and indel in genomes of two macrolide-resistant isolates.
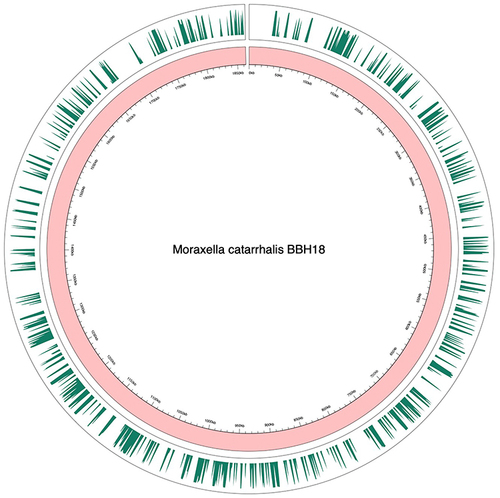
Table 3 Common Site of Indel Mutation in Two Macrolide-Resistant Moraxella catarrhalis