Figures & data
Table 1 Bacterial Strains and Plasmids Used in This Study
Table 2 Primers Used in This Study
Figure 1 Growth curves of Newman, Newman-ΔNWMN2330, Newman-ΔNWMN2330-C. The data were analyzed by one-way ANOVA, and there was no difference in daily bacterial growth between Newman and Newman-ΔNWMN2330.
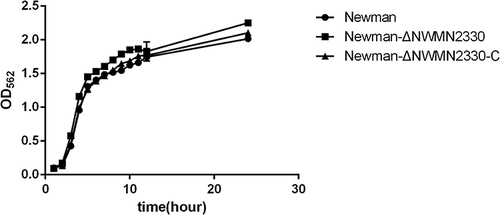
Table 3 Newman-ΔNWMN2330 vs Newman Genes with Significantly Changed Expression
Figure 2 Volcano graph showing the difference in expression between Newman and Newman-ΔNWMN2330. The abscissa represents the fold change of gene expression in different samples; the ordinate represents the statistical significance of the difference in gene expression; the red dots in the figure indicate the up-regulated genes with significant differential expression, and the green dots indicate the down-regulation of significant differential expression gene.
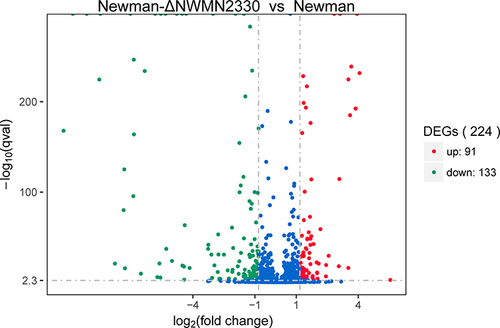
Figure 3 Scatter plot of KEGG enrichment of differential genes. The vertical axis represents the name of the pathway, the horizontal axis represents the enrichment factor, the size of the dots indicates the number of differentially expressed genes in this pathway, and the color of the dots corresponds to different q value ranges.
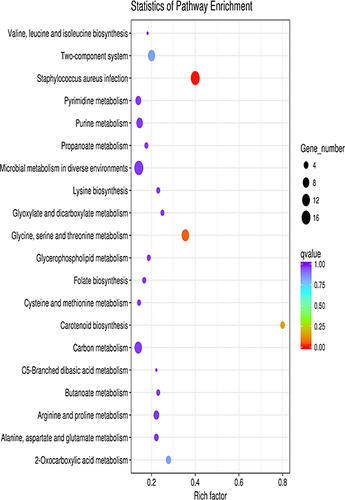
Figure 4 RT-PCR results of hla. Newman represents the wild strain, Newman-ΔNWMN2330 represents the deletion mutant, Newman-ΔNWMN2330-C represents the reverted strain. Statistical significance was determined by the unpaired t-test, wild strain compared to deletion mutant strain, and ****Represents P<0.0001.
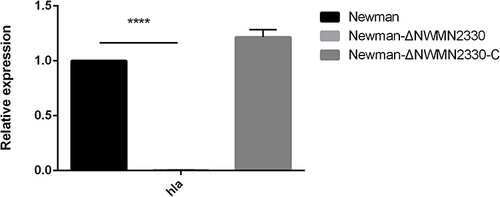
Figure 5 (A) ELISA detects the amount of α-toxin produced by each strain; (B) Colombian blood agar medium detects the hemolytic capacity of each strain; (C and D), detects the hemolytic activity of each strain.
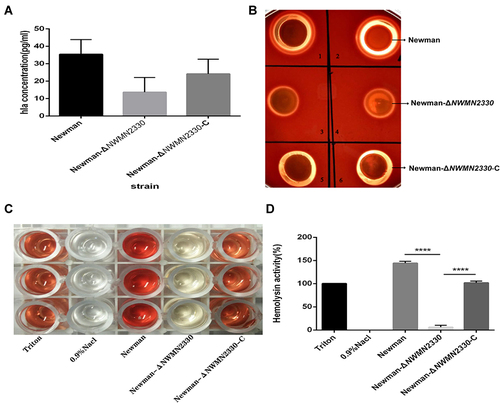
Figure 6 Determination of silkworms survival rate (N=12). PBS injection was used as a negative control. Statistical significance was determined by the Gehan-Breslow-Wilcoxon test, wild strain compared to deletion mutant strain and **Represents P<0.01.
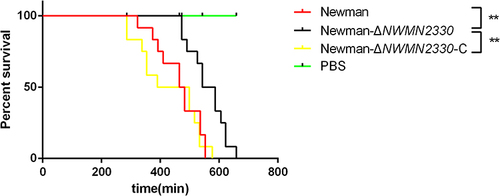
Figure 7 Results of nude mouse skin abscess model. PBS injection was used as a negative control. Statistical significance was determined by the unpaired t-test, wild strain compared to deletion mutant strain, *P < 0.05, **P < 0.01.
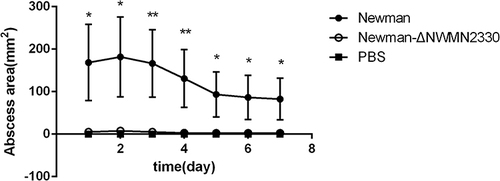
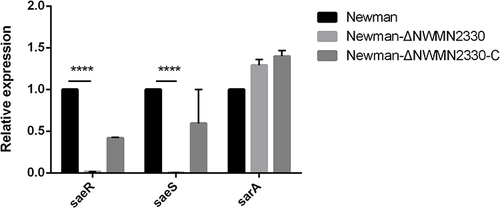
Figure 8 Relative expression of saeRS and sarA at the mRNA level. Statistical significance was determined by the unpaired t-test, wild strain compared to deletion mutant strain, ****Represents P<0.0001.