Figures & data
Figure 1 Flow diagram of cases inclusion and exclusion.
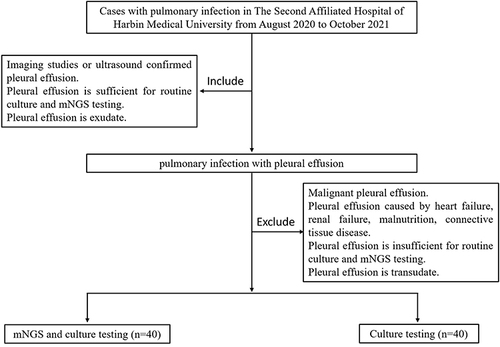
Table 1 Baseline Characteristics of Participants
Figure 2 Sensitivity and specificity with 95% confidence intervals were calculated under different threshold.
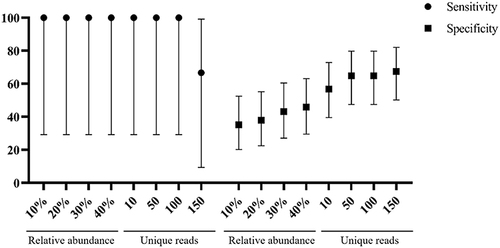
Figure 3 Genus distribution of bacteria (A), fungi (B), and virus (C) detected by mNGS. Streptococcus and Prevotella, Candida, and Cytomegalovirus were the most commonly detected bacteria, fungi, and viruses, respectively.
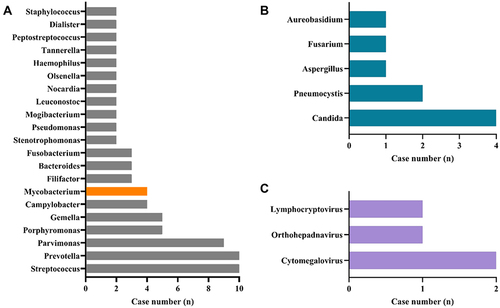
Figure 4 Percentage of patients with infections for various pathogens.
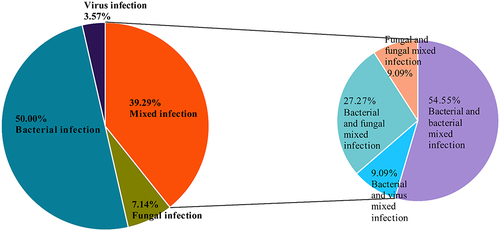
Figure 5 (A-1) The influence of Fever, Hypoproteinemia, Empyema on the detection rate of mNGS in pulmonary infections. Positive/negative represent case with/without these symptoms, respectively. Chi-squared Test. (A-2) Proportion of infection type of pulmonary infection with hypoproteinemia detected using mNGS. B-1The influence of WBC, NEUT% and D-dimeron the detection rate of mNGS in pulmonary infections. Chi-squared Test. (B-2) and (B-3) Proportion of infection type of pulmonary infection with abnormal level of NEUT% and D-dimer detected using mNGS. WBC, white blood cell; NEUT, neutrophil. * represents P values < 0.05.
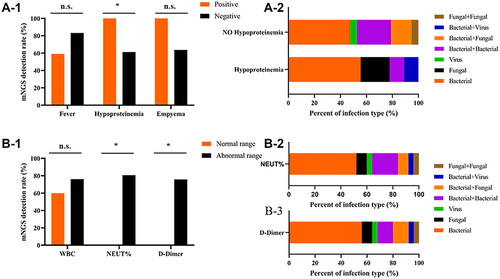
Figure 6 The comparisons of WBC (A), neutrophil (B) and D-dimer(C) across mNGS groups. * Represents P values < 0.05.
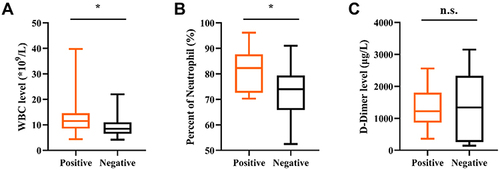
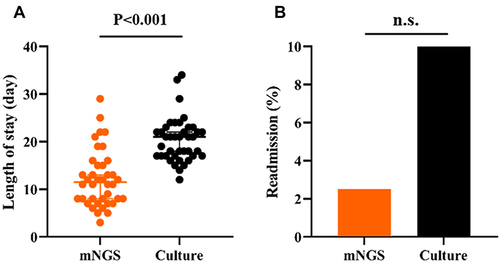
Figure 7 Length of stay (A) and readmission (B) comparison between mNGS and culture for pulmonary infection.