Figures & data
Figure 1 Map of Southern Nations Nationalities and Peoples Regional State (SNNPRS) displaying administrative zones and special woredas covered by the study (retrieved at: www.rippleethiopia.org/page/snnpr).
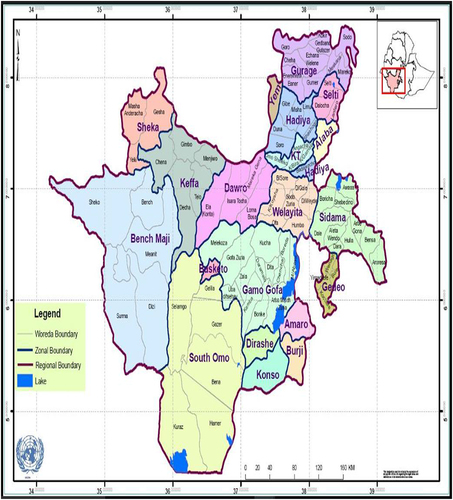
Table 1 Socio-Demographic Characteristics of Covid-19 Cases Admitted to Treatment Centers of Southern Ethiopia, 2021
Table 2 Clinical Characteristics of Covid-19 Cases Admitted to Treatment Centers of Southern Ethiopia from May 30, 2020–October 15, 2021
Figure 2 Frequency distribution of types of comorbidity among Covid-19 cases admitted to treatment centers of Southern Ethiopia from May 30, 2020–October 15, 2021.
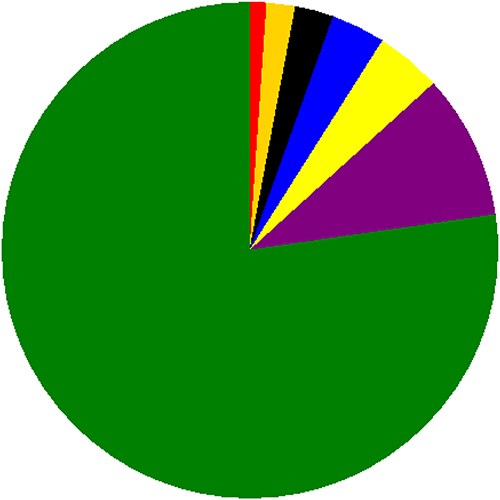
Figure 3 Percentage distribution of Severity levels among Covid-19 cases admitted to treatment centers of Southern Ethiopia from May 30, 2020- October 15, 2021.
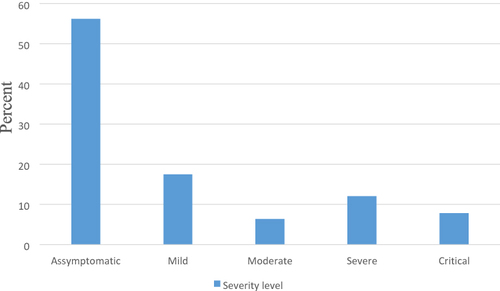
Figure 4 Percentage distribution of treatment outcome among Covid-19 cases admitted to treatment centers of Southern Ethiopia from May 30, 2020–October 15, 2021.
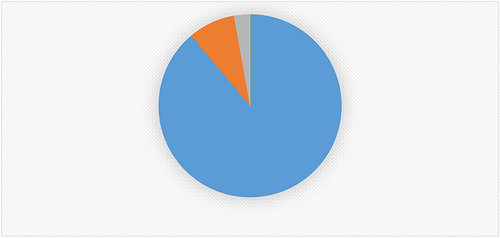
Table 3 Incidence Density of Recovery by Strata of Categorical Variables Among Covid-19 Cases Admitted to Treatment Centers of Southern Ethiopia from May 30, 2020–October 15, 2021
Figure 5 Cumulative survival distribution among Covid-19 patients admitted to treatment centers of Southern Ethiopia from May 30, 2020–October 15, 2021.
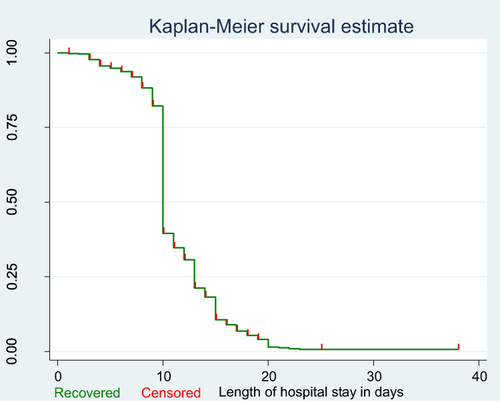
Figure 6 Cumulative survival distribution by age among Covid-19 patients admitted to treatment centers of Southern Ethiopia from May 30, 2020–October 15, 2021.
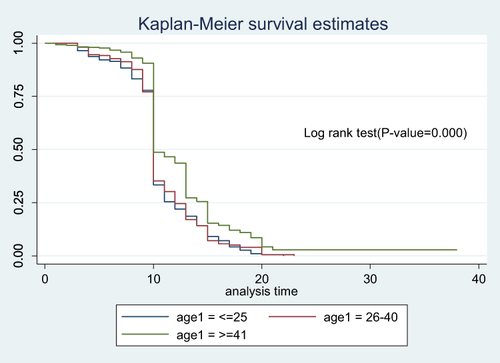
Figure 7 Cumulative survival distribution by sex among Covid-19 patients admitted to treatment centers of Southern Ethiopia from May 30, 2020–October 15, 2021.
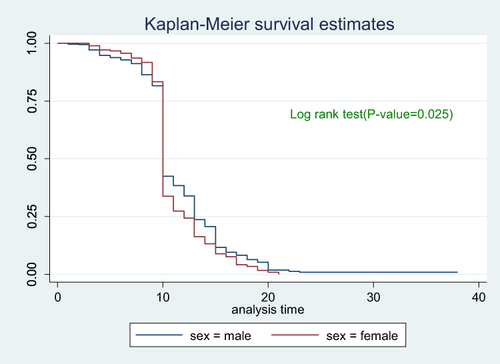
Figure 8 Cumulative survival distribution by comorbidity among Covid-19 patients admitted to treatment centers of Southern Ethiopia from May 30, 2020–October 15, 2021.
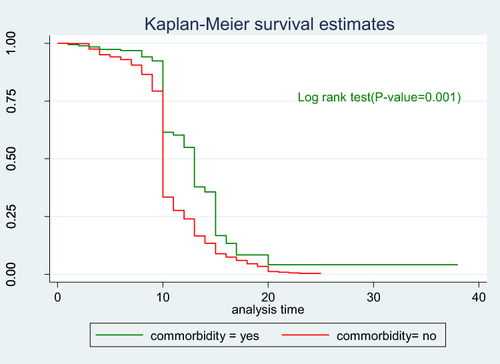
Figure 9 Cumulative survival distribution by severity among Covid-19 patients admitted to treatment centers of Southern Ethiopia from May 30, 2020–October 15, 2021.
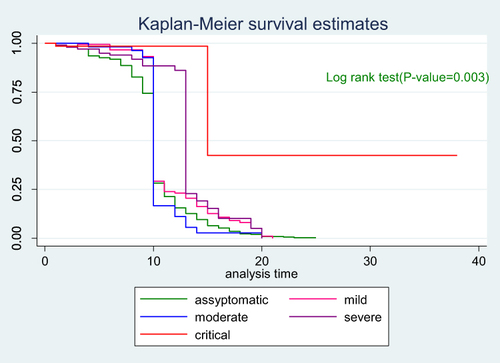
Table 4 Cox Proportional Hazards Analysis of Predictors of Time to Recovery Among Covid-19 Patients Admitted to Treatment Centers of Southern Ethiopia from May 30, 2020–October 15, 2021
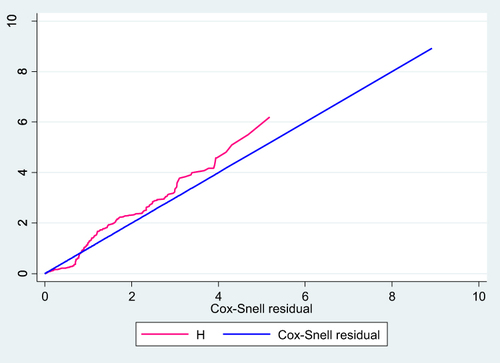
Figure 10 Cox Snell residual test for overall adequacy of the model fitted for time to recovery among Covid-19 patients admitted to treatment centers of Southern Ethiopia from May 30, 2020–October 15, 2021.