Figures & data
Table 1 Antibiotic Susceptibility Profiles of Enterobacter hormaechei Isolate DY1901
Figure 1 Construction of phylogenetic trees of E. hormaechei. The figure includes the sample source of the isolate, antibiotic resistance gene, and the comparison result of the virulence gene. Red dots denote pathogens of clinical origin, blue dots denote pathogens of environmental origin, and yellow dots denote unknown pathogen sources. The aligned antibiotic resistance and virulence genes are indicated by blue and black squares.
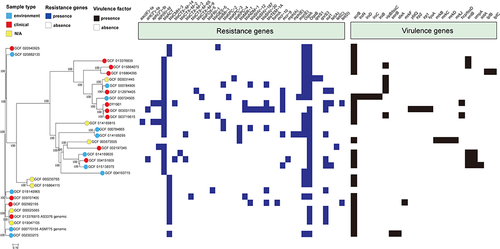
Figure 2 S1 Nuclease-Pulsed Field Gel Electrophoresis (S1-PFGE) and southern blot. The S1-PFGE characterized the number and size of the plasmids of the two isolates. The location of blaNDM-1 and mcr-9 was confirmed by Southern blot. (A) is the location and size of blaNDM and (B) is the location and size of mcr-9.
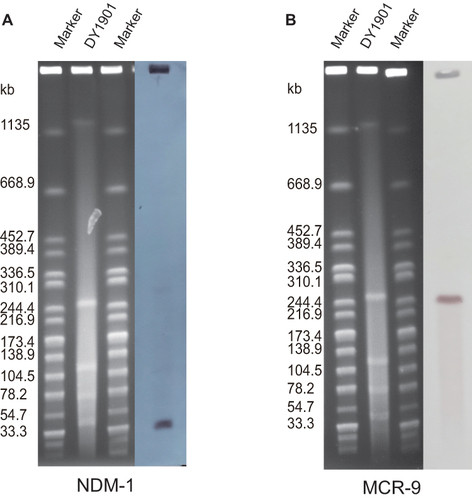
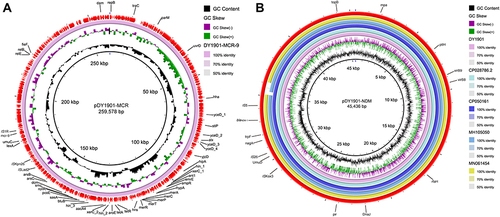
Figure 3 Plasmid profiles of blaNDM-1 and mcr-9 carrying plasmid from E. hormaechei isolate. Sequence comparison of scaffolds (portions of genome sequences reconstructed from WGS data). Arrows indicate the positions and direction of the transcription of genes. The reference plasmid is marked in pink in the inner circle. The color intensity in each ring represents the BLAST match identity. (A) is the plasmid construct carrying mcr-9 and (B) is the plasmid construct carrying blaNDM.