Figures & data
Figure 1 Flow chart showing the construction of RF, SVM, and SVM-K models.
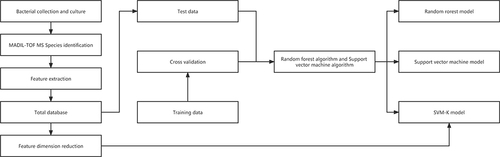
Figure 2 Top 10 peaks as per importance and intergroup proportion.
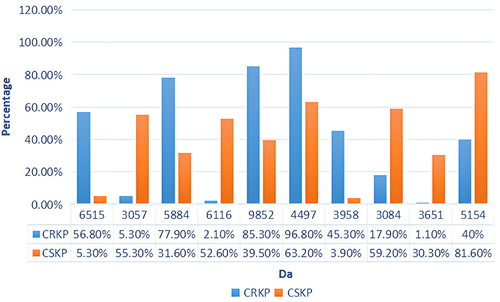
Figure 3 A plot of accuracy fluctuations in model construction by continuously removing the lowest-ranked features. For the range 105–153, the model accuracy was >0.9.
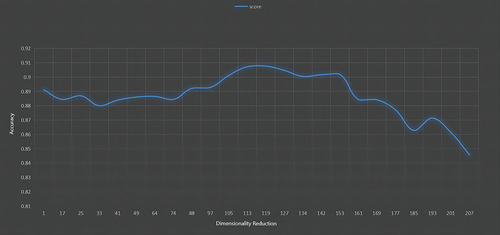
Figure 4 Box plots showing the accuracy, sensitivity, and specificity of the three classification models; RF (accuracy 0.88, sensitivity 0.82, specificity 0.93), SVM (accuracy 0.88, sensitivity 0.85, specificity 0.92), and SVM-K (accuracy 0.91, sensitivity 0.89, specificity 0.94).
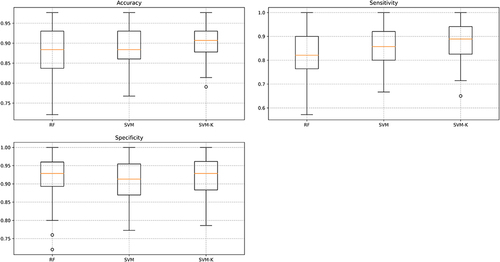
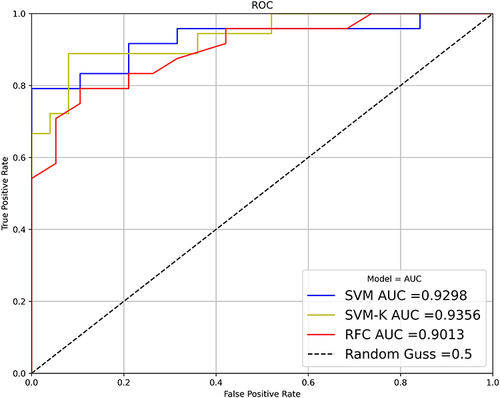
Figure 5 AUC plots of the 3 classification models.