Figures & data
Figure 1 Time series of tuberculosis incidence in Anhui province from January 2013 to June 2020.
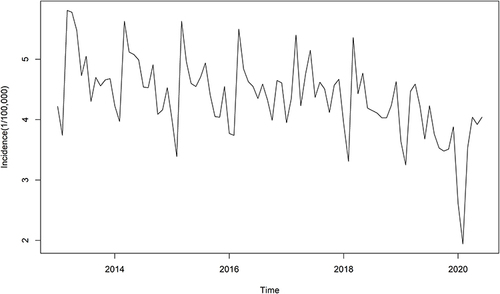
Figure 2 Monthly figure of tuberculosis incidence in Anhui province from 2013 to 2020.
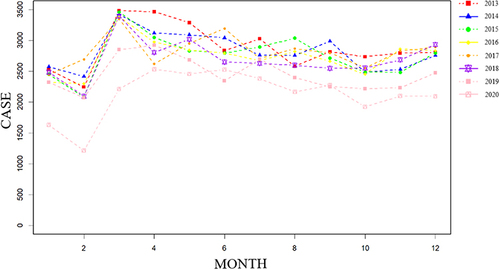
Figure 3 Geographic distribution of the average annual incidence of pulmonary tuberculosis in Anhui province, 2013–2020.
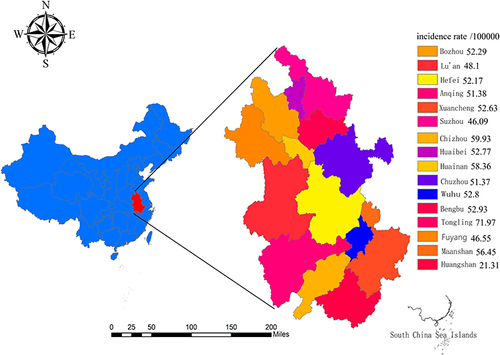
Figure 4 Time series of tuberculosis incidence in Anhui province from January 2013 to June 2020 after first order difference.
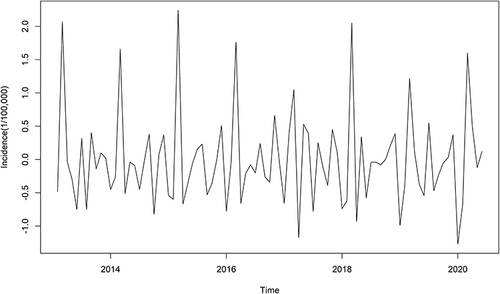
Figure 5 ACF(A) and PACF(B) function diagram after first order difference.
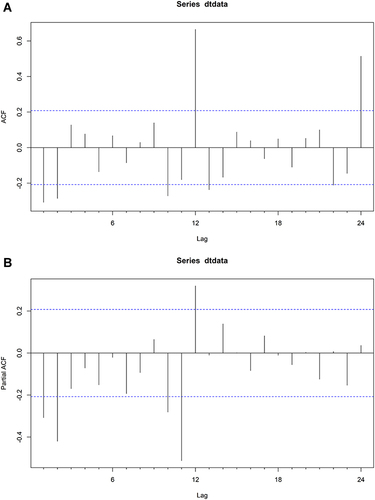
Table 1 Prediction of Tuberculosis Cases in Anhui from July to December in 2020
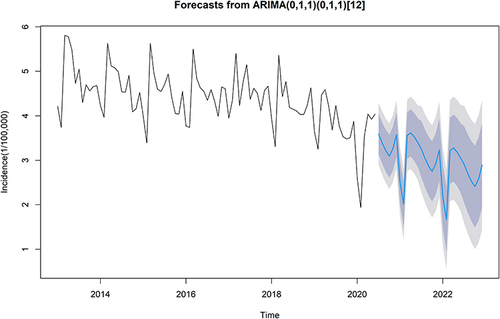
Table 2 Prediction Results of Monthly Incidence of Tuberculosis from January 2021 to December 2022
Figure 6 Prediction of tuberculosis incidence in 2021 and 2022 and 80% and 95% confidence intervals.