Figures & data
Table 1 The Clinical Characteristics of the Enrolled Neonates
Figure 1 The chemokines and cytokines were significantly different between controls and neonatal sepsis. The levels of CXCL13 (A), CCL27 (B), CXCL5 (C), CX3CL1 (D), CXCL6 (E), CXCL1 (F), CXCL2 (G), IL-1β (H), IL-6 (I), IL-8 (J), CCL2 (K), CCL8 (L), MIF (M), CCL3 (N), CCL20 (O), CCL23 (P), TNF-α (Q), and CXCL16 (R) in serum from controls (n=26) and neonatal sepsis (n=40). The red horizontal lines show the medians and interquartile range. The difference between control and neonatal sepsis was assessed using the Mann–Whitney U-test.
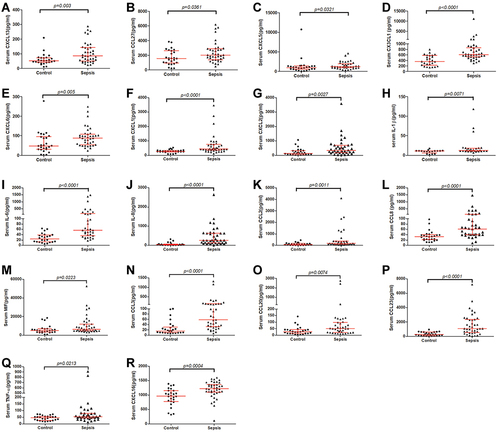
Table 2 The Clinical Characteristics of EOS and LOS
Figure 2 The levels of IL-17 (A), CCL20 (B), and IL-16 (C) in serum from control(n=26, EOS (n=10) and LOS (n=30). The red horizontal lines show the medians and interquartile range. The difference between control and neonatal sepsis was assessed using the Kruskal–Wallis H-test. *P < 0.05; **P < 0. 01.
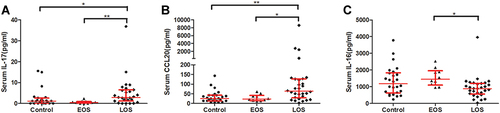
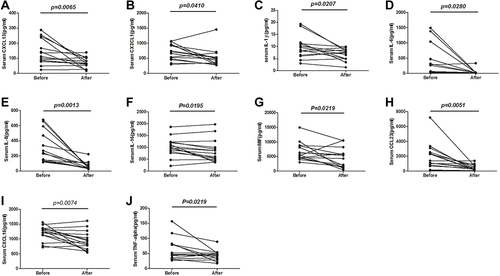
Figure 3 Levels of cytokines and chemokines before and after treatment in 15 neonates with sepsis. The levels of CXCL13 (A), CX3CL1 (B), IL-1β (C), IL-6 (D), IL-8 (E), IL-16 (F), MIF (G), CCL23 (H), CXCL16 (I), and TNF-alpha (J) in serum from sepsis neonates (n=15) before and after treatment. Differences before and after treatment were analyzed using the Wilcoxon test.