Figures & data
Figure 1 Distribution trend of vancomycin MIC values (2016–2020) (n = 440). MRSA isolates with vancomycin MIC values of 0.5µg/mL and 0.75µg/mL remained at very low levels throughout the years (lower two lines). Isolates with MIC 1µg/mL show an evident decline as indicated with the grey line while isolates with MIC value of 2µg/mL show a clear rising trend (dark blue line). At the top of the figure, the yellow line depicts the highest percentage of MRSA isolates with vancomycin MICs values of 1.5 µg/mL.
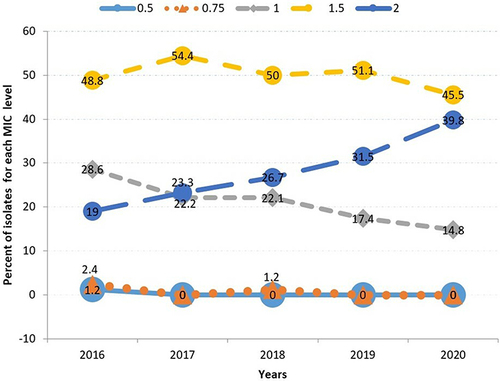
Table 1 Distribution of SCCmec Gene in MRSA Isolates (2016–2020)
Figure 2 Gel electrophoresis pattern for identification of SCCmec types and subtypes by multiplex PCR for clinical isolates of MRSA. Lane 1 is negative control. Lanes 2 represents SCCmec type IVe (175bp); lane 3 represents SCCmec type IVb (493bp); lane 4 represents SCCmec type IVd (881bp); lane 5 represents SCCmec type Iva (776bp); lane 6 represents SCCmec type I (613bp); lane 7 represents SCCmec type IVc (200bp); lane 8 represents SCCmec type II (398bp). SCCmec type III a (257bp); lane 10 represents SCCmec III type (280bp) and lane 11 represents SCCmec type V (325bp). Lane 12 is empty. M is the 100 bp DNA ladder (Thermo Scientific).
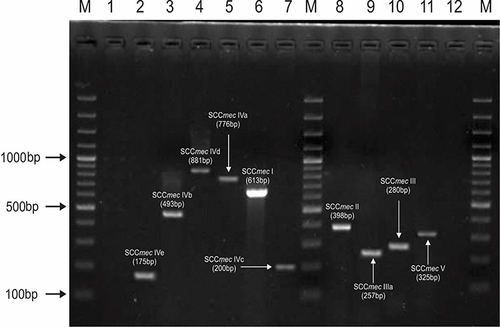
Figure 3 Gel electrophoresis pattern for identification of SCCmec type XI by multiplex PCR for clinical isolates of MRSA. M is a 100 bp DNA ladder (Thermo Scientific). Lane 1: negative control; lane 2 represents positive control of SCCmec XI ATCC- BAA 23122, Lane 3: MRSA strain represents SCC mec type XI carrying mec1 (344bp); mecR1 (710bp); blaZ (809bp); ccrA1 (932bp) and ccrB3 (1499bp).
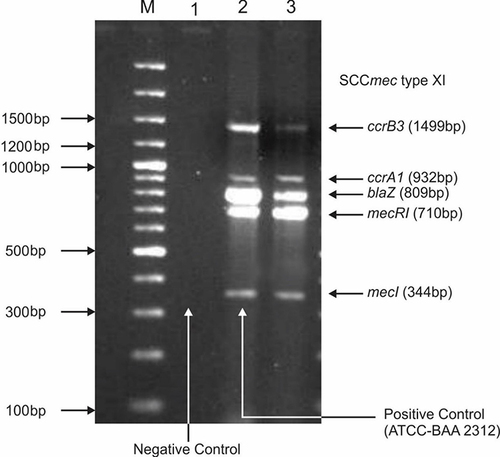
Figure 4 Dendrogram based on the clustering of strains according to similarity index (by Dice coefficient and UPGMA approach) through MLVA analysis of MRSA strains. By MLVA analysis 120 isolates were clustered into 60 haplotypes based on similarity index due to slight variations in VNTRs using Bionumerics Software version 8.0. A dendrogram was produced with the settings of position tolerance (optimization 1% and band position tolerance 0.75%). All strains were shuffled according to their similarity index and clustered into genotypes.
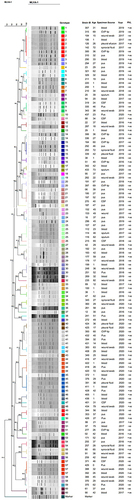
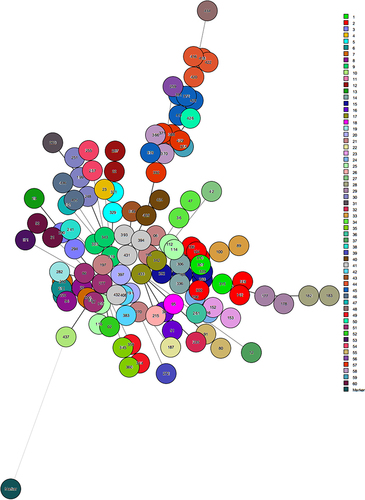
Figure 5 Minimum Spanning Tree analysis of MRSA isolates depicting their phylogenetic relationship according to VNTRs (clfA, clfB, sdrD, sdrC, sdrE, spa and sspa) distribution index. It is based on slight base pair variations leading to a new MLVA type strain using Bionumerics software version 8.0. In this MST analysis total 60 clusters were found. Circles are representing MRSA isolates and the same colored circles belong to one genotype. Furthermore closely related genotypes were connected with bold lines while distantly related were connected with thin lines.