Figures & data
Figure 1 A cylindrical tube stethoscope made of a hollow potato chip packaging barrel (diameter: 6.5 cm, length: 20 cm) covered by a piece of A4 paper sprayed with 500 mg/L chlorine dioxide. A silicone gasket matched with the barrel was installed on the auscultation side to avoid sound leakage from the stethoscope.
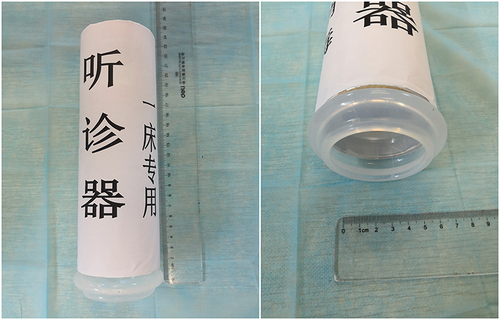
Figure 2 Frequency spectra of sound pressure levels measured using the original stethoscope. (A) Measured at the triangle of auscultation of the lungs. (B) measured at the apex area of the heart. (C) measured at McBurney’s point of the intestines.
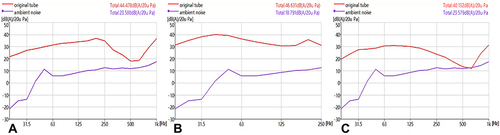
Figure 3 The measured and calculated pulmonary sound pressure levels of the cylindrical tube stethoscope.
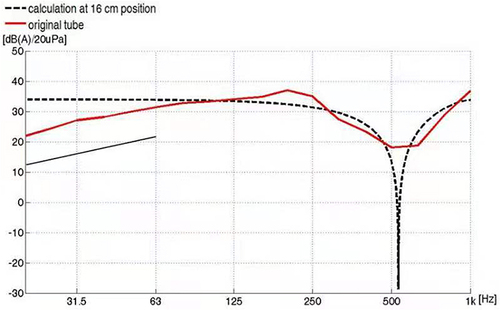
Figure 4 Comparison of the frequency spectra of 3 M Littmann lightweight stethoscopes and cylindrical tube stethoscopes. (A) Pulmonary auscultation. (B) Cardiac auscultation. (C) Intestinal auscultation.
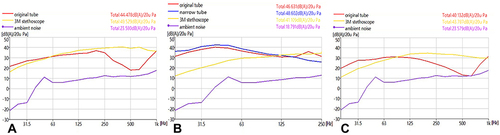
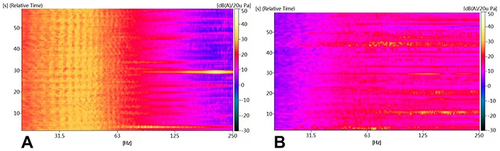
Figure 5 Spectrogram of heart sound signals of all ten volunteers measured using stethoscope (A) the cylindrical tube stethoscope. (B) the 3 M stethoscope.