Figures & data
Figure 1 Comparison of the reactivity of clones identified by phage display between the sera of patients who were positive and negative for C. trachomatis. (A) Phage ELISA with the clones selected by biopanning and sequenced. The clones marked with “*” were selected for use in the ELISA optimization test. Evaluation of reactivity by phage ELISA of individual samples with clones G1 (B), H5 (C), H7 (D) and C6 (E).
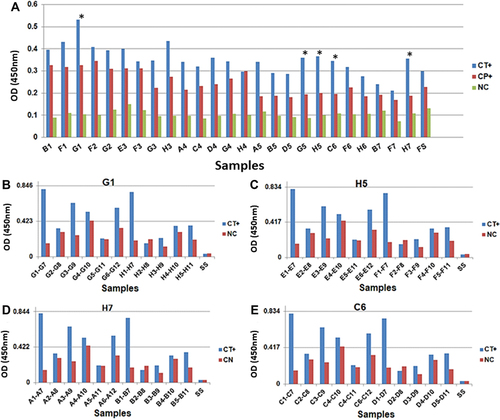
Table 1 Amino Acid Sequences of the Clones That Showed the Best Performance in the Phage ELISA Tests
Figure 2 Conformational alignment of peptides from clones G1, H5, C6 and H7 in CPAF of C. trachomatis.
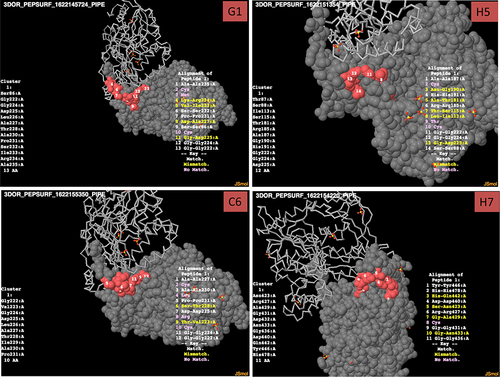
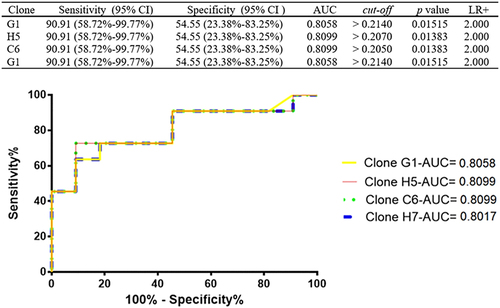
Figure 3 Statistical parameters of the mimetic peptides. Sensitivity, specificity, likelihood ratio (LR) and area under the curve (AUC) and ROC curve.