Figures & data
Table 1 The Demographic Data of 141 Participants Vaccinated with Different COVID-19 Vaccines
Figure 1 An association between anti-S IgG antibody and age group. (A) Different age groups and number of samples in each group. Nonparametric Mann–Whitney U-test was used to compare between different age group. (B) Negative correlation of antibody with age (13–88 years) and the correlation was analyzed using Pearson's test, (N=63, r= −0.32, p=0.01). (C) Negative correlation of saliva IgG with age; and analyzed using Pearson's test, (N=78, r= −0.3, p=0.02).
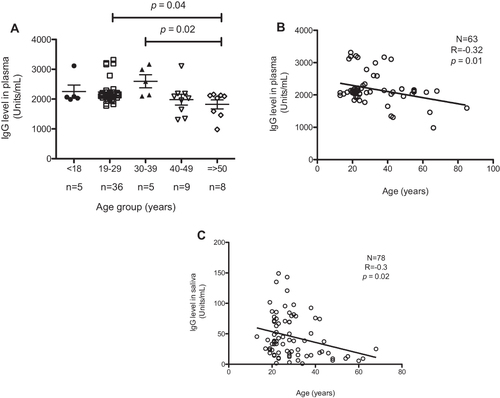
Figure 2 Comparison of IgG levels in three months vs six months. (A) Nonparametric Mann–Whitney U-test was used to compare three months (n=51) with six months (n=12). (B) Nonparametric Mann–Whitney U-test was used to compare three months (n=50) with six months (n=28). All data presented as median with interquartile range 25–75.
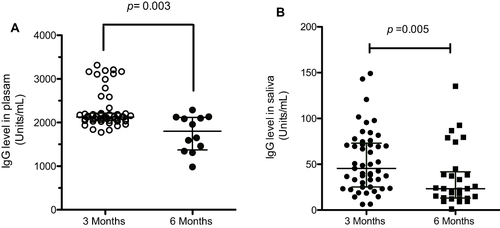
Figure 3 IgG titer in plasma and saliva after different vaccine. The level of antibodies between different vaccine types was considered in those subjects. (A) Plasma samples, Pfizer; n= 7; AstraZeneca; n=12, mixture vaccine; n=14. (B) Saliva samples, Pfizer; n=35; AstraZeneca; n=19, mixture vaccine; n=24. Nonparametric Mann–Whitney U-test was used to compare between different vaccine types. All data presented as standard error of mean (SEM).
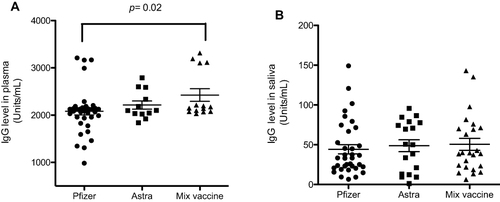
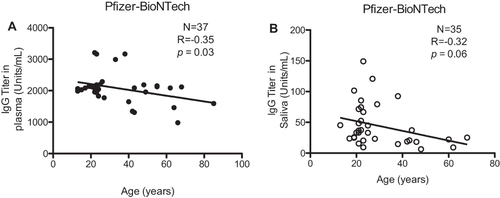
Figure 4 The IgG levels waned post two doses of Pfizer-BNT162b2 in the aged group. (A) Negative correlation of antibody with age after two doses and the correlation was analyzed using Pearson's test, (N=37, r= −0.35, p=0.03). (B) Negative correlation of saliva IgG with age; and analyzed using Pearson's test, (N=35, r= −0.32, p=0.06).