
Figures & data
Table 1 Demographic Characteristics of Pediatric Oncology Patients with Bacteremia
Table 2 Types of Gram-Positive Bacteria Which is Isolated in Blood Cultures for Patients Aged 13 Years or Less Receiving Chemotherapy and Its Antimicrobial Resistance Pattern
Figure 1 Distribution of gram-negative bacterial growth within blood cultures of children aged less than 13 years receiving chemotherapy.
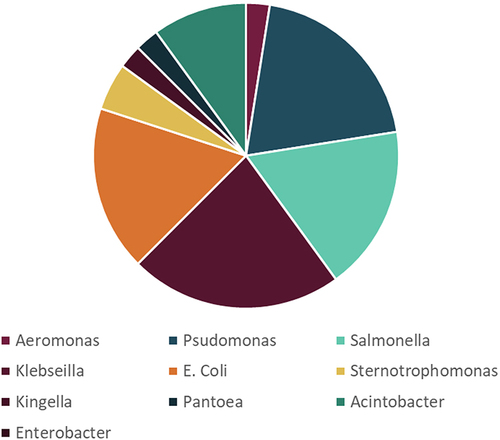
Figure 2 Distribution of gram-positive bacterial growth within blood cultures of children aged less than 13 years receiving chemotherapy.
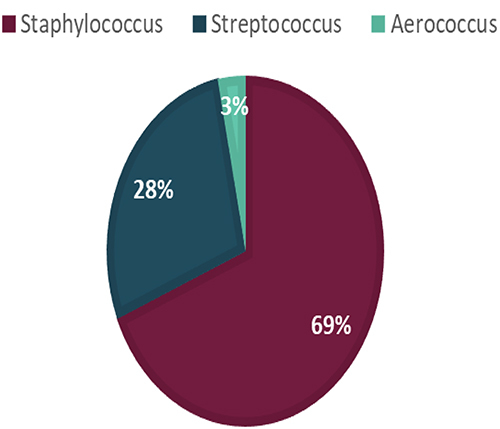
Table 3 Types of Gram-Negative Bacteria Isolated in Blood Cultures for Patients and Its Antimicrobial Resistance Pattern