Figures & data
Table 1 PCR Primer Sequence Information of Antimicrobial Resistance Genes
Table 2 PCR Primers Sequence Information of Virulence Genes
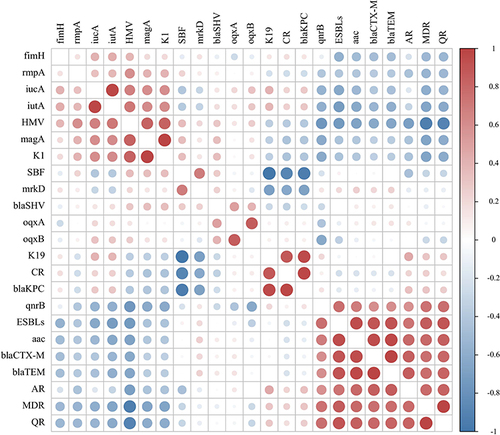
Figure 1 The resistant rates of 20 K. pneumoniae isolated from sputum against 13 antibiotics.
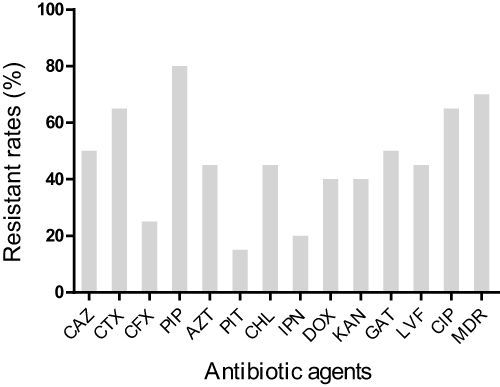
Table 3 Distribution of Antibiotic Resistance Genes and ESBL Phenotype in 20 Strains of K. pneumoniae
Table 4 Distribution of Virulence Genes of K. pneumoniae Isolated from Sputum
Figure 2 Phylogenetic tree of 20 K. pneumoniae isolated from sputum base on wzi gene sequence. Phylogenetic trees were constructed using MEGA 7 based on the neighbor-joining method (500 bootstrap replicates) and Jukes-Cantor distance. Each sequence corresponds indicated a distinct wzi allele. The corresponding capsular types followed the allele number.
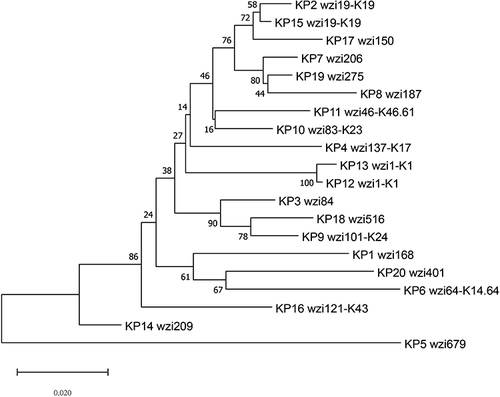
Figure 3 Pearson’s correlation analysis between phenotypes and genotypes of 20 K. pneumoniae isolated from sputum. Red is positive correlations and blue is negative correlations between different parameters.