
Figures & data
Table 1 Summary of the Minimum Inhibitory Concentrations of Nine Antimicrobials Against 182 M. pneumoniae Isolates
Table 2 Cumulative Bacteriostatic Rates (%) of the Nine Antimicrobials Against 182 M. pneumoniae Isolates
Figure 1 Comparison of M. pneumoniae P1 subtypes in Shanghai between 2017 and 2019. (A) Distribution of the P1-1 and P1-2 subtypes (p = 0.693). (B) Macrolide resistance rate in P1-1 (p = 0.347) and P1-2 (p = 0.054).
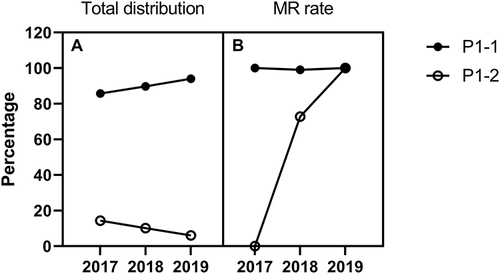
Table 3 Summary of the Genotypes of 182 M. pneumoniae Isolates in Shanghai from 2017 to 2019
Figure 2 The minimum spanning tree (MST) of the 182 M. pneumoniae strains depends on the 5-loci scheme MLVA types. Clustering of the MLVA profiles was based on the categorical coefficient. Each circle represents one MLVA type and the size of the circle is directly proportional to the number of isolates. The distance of the line between the MLVA types corresponds to the total number of allelic changes. (A) MST with colors based on the collection years. Circles with dashed lines delineate the MLVA lineages. (B). MST with colors depends on the P1 subtypes.
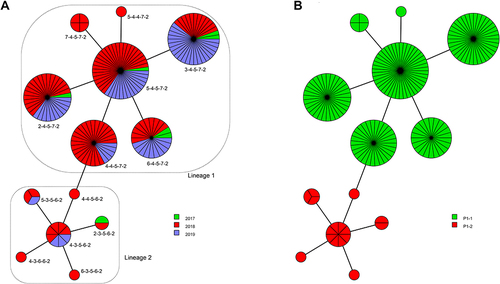
Table 4 Correlations Between the P1 Subtypes and the MLVA Types