Figures & data
Figure 1 Mucoviscosity and CPS production are reduced in LVX-treated strains. Uronic acid mucoviscosity (A) and CPS production (B) were assessed as described in Materials and Methods. The data presented here are from a representative assay. The one-way ANOVA test was performed to determine statistically significant differences between different concentrations of LVX and without LVX, ***p < 0.001. The mucoviscosity determined by centrifugation was represented by OD600 of three independent experiments (mean±SD). (0 vs 1/2MIC, 0 vs 1/4MIC, 0 vs 1/8MIC, 0 vs 1/16MIC, ***p < 0.001). The amount of CPS was represented by OD520 of three independent experiments (mean±SD). (0 vs 1/2MIC, 0 vs 1/4MIC, 0 vs 1/8MIC, 0 vs 1/16MIC, ***p < 0.001, *p < 0.05).
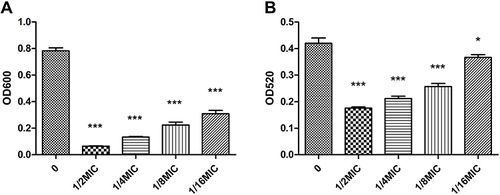
Figure 2 Bacterial growth curve at different concentrations of levofloxacin. Low concentration (≤1/4MIC) of LVX does not affect the hvKp growth. Bacterial cultures were grown at 37°C for 18 h.
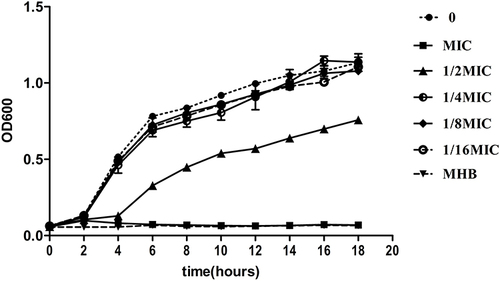
Figure 3 (A) Under the sub-inhibitory concentration of LVX overnight, the capsule thickness was measured after ink staining. The higher the concentration of LVX, the thinner the capsule. ***p < 0.001 (compared to 0 group), ###p < 0.001 (compared to 700603). (B) Bacterial capsule thickness measured with or without LVX over time. (C) Bacterial capsule thickness measured after removal or persistence of LVX over time.
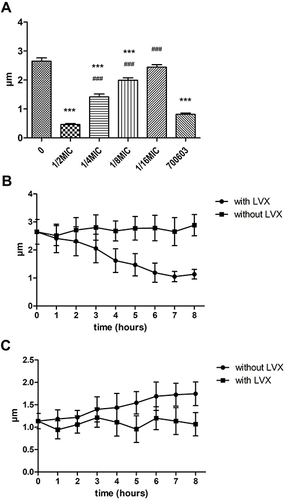
Figure 4 LVX represses the transcription of capsular and other virulence genes in B16. qRT-PCR was performed to analyze the transcriptional levels of gal, magA, manC, rmpA, wzi, iroN and iucA genes. Bacterial cultures with or without LVX were grown at 37°C for 8 h. 16S rRNA was used as a reference gene for normalization. Data represent the mean of three independent experiments performed in triplicates. Statistically significant with respect to the hvKp grown in MHB medium without LVX. *p < 0.05, ***p < 0.001.
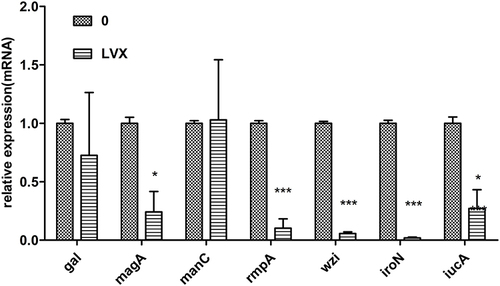
Figure 5 Phagocytosis of K. pneumoniae. The percentage of phagocytosis against hvKp increased significantly after treatment with LVX (***p < 0.001).
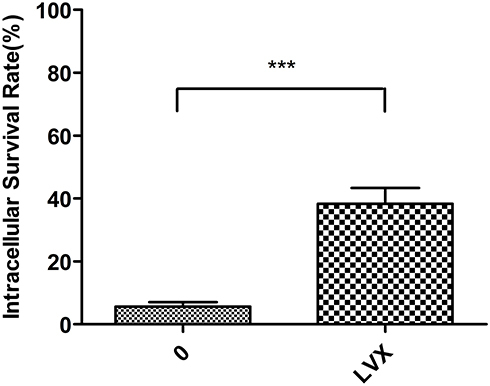
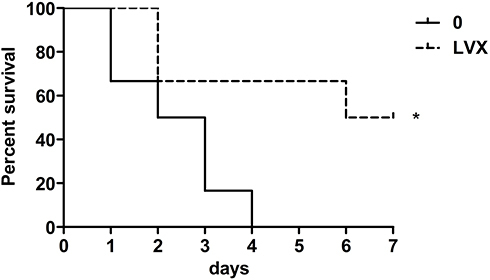
Figure 6 Survival curve of mice injected bacteria with doses of 106 CFU bacteria. The Log rank (Mantel–Cox) test was performed to determine statistically significant differences between the two groups. (*p<0.05).