
Figures & data
Figure 1 The distribution of BSI pathogens by year.
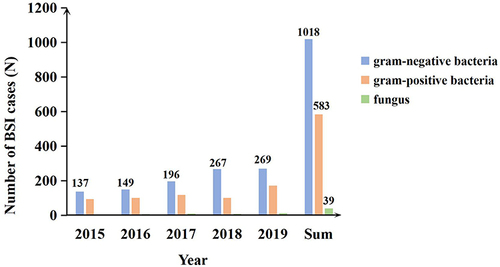
Table 1 The Department Distribution of GNBSI Cases
Figure 2 The age distribution of GNBSI cases. Sum means the total number of patients of each age group over five years.
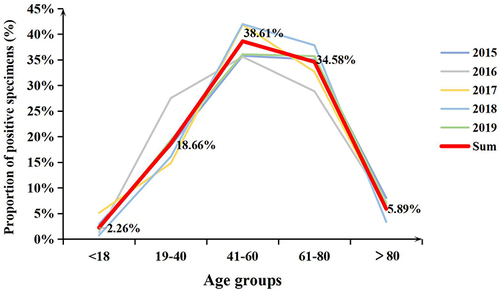
Figure 3 The mortality of GNBSI cases by year.
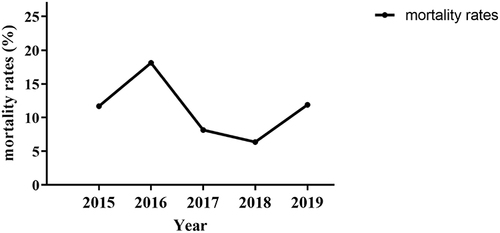
Figure 4 The number and isolation rate of the top six GNBSI strains.
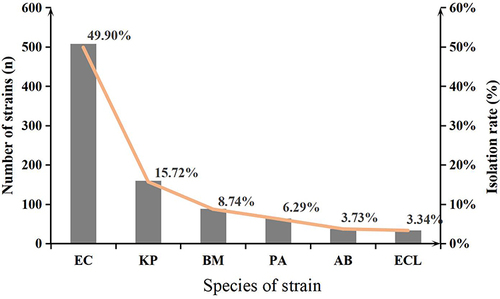
Figure 5 The variation trend of MDR, ESBLs-producing and carbapenem-resistant strains. (A) The quantity variation trend of MDR, ESBLs-producing and carbapenem-resistant strains. (B) The variation trend of isolation rate of MDR, ESBLs-producing and carbapenem-resistant strains. *p < 0.05.
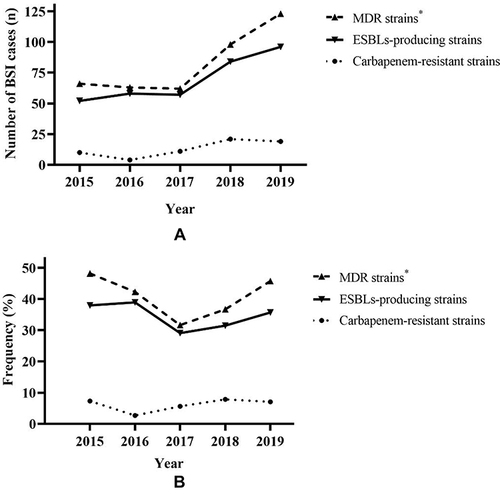
Table 2 Antibiotic Resistance Results for the Most Common Isolated Bacteria
Table 3 Predictors of Mortality with GNBSIs
Table 4 Risk Factors for MDR in GNBSIs Patients
Table 5 Risk Factors for ESBLs-Producing in GNBSIs Patients
Table 6 Risk Factors for Carbapenem-Resistant in GNBSIs Patients