Figures & data
Table 1 General Information on Wastewater Treatment Plants and Sampling Sites
Figure 1 Map of water sampling sites along the Tama River and around Tokyo Bay area. (A) WWTP (WP) effluents and surface water from a recreational beach (BEC) were obtained for AMR investigations in this study. (B) Taxonomic classification of the domain rank of the effluents from WPs (WP1–9) and a recreational beach (BE) based on metagenomic DNA-Seq analysis results.
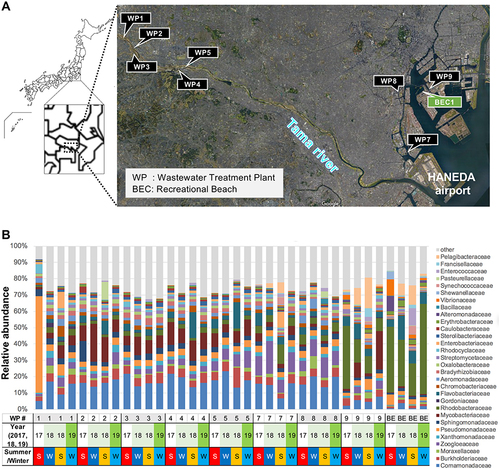
Figure 2 Metagenomic analysis of bacteria in WWTP effluents. (A) NMDS plots of metagenomic sequencing reads classified at the genus level for WWTP (WP1–9) effluents and a recreational beach sample (BEC1). Freshwater areas in WWTPs (WP1–8, see ) were clustered (gray-shaded area). Clusters were separated in a season-dependent manner but were not WWTP dependent. (B) Seasonality was observed in multiple bacterial genera using LEfSe analysis (score threshold: 2.0).
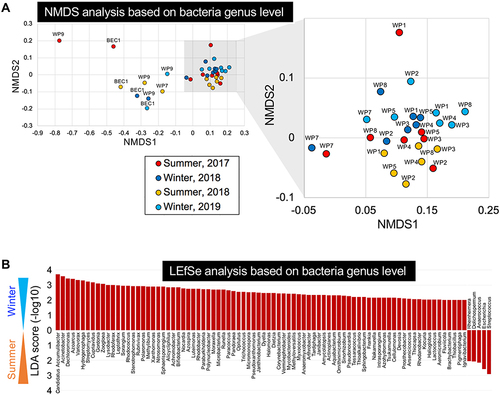
Figure 3 Metagenomic analysis of ARGs in WWTP effluents. (A) ARG detection in the effluents from WWTP (WP) and beach (BE) samples. Metagenomic DNA-seq short reads were analyzed for homology using the ResFinder ARGs database, followed by RPKM normalization. See Supplementary Table 2 for the detailed list of detected ARGs. (B) NMDS plots of metagenomic sequencing reads classified for ARGs in effluents from WWTPs (WP1–9) and a recreational beach (BEC1). Freshwater areas in WWTPs (WP1–8, see ) were clustered (gray-shaded square), but the plots were separated in a sampling time-dependent manner with partial WWTP-dependency for WP8.
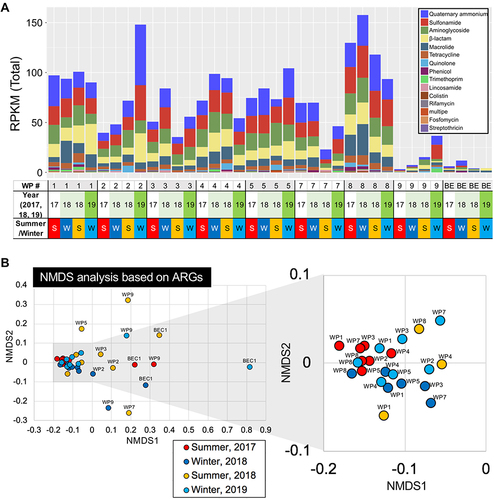
Figure 4 ARG profiling based on AMR categories. (A) Trends in ARG variations, the detected ARGs in each AMR category at every sampling site, and a unique season-dependent ARG in (B) summer and (C) winter. *p<0.05, **p<0.01. WP1-17S stands for the sample at WP1 site in 2017 summer.
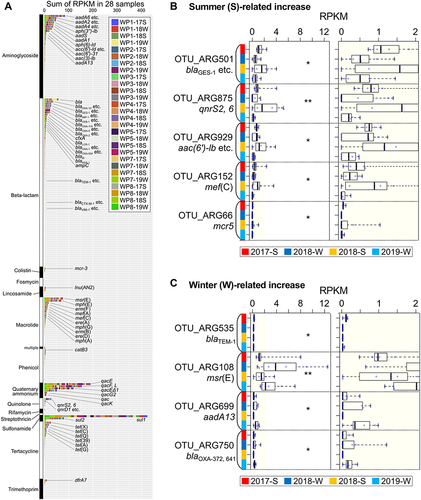
Figure 5 Seasonal or temporal trends of ARG profiles from the WWTP-dependent treated area. (A) Seasonal (or temporal) or (B) WWTP-dependent ARG differences shown in RPKM fold change (log2 ratio).
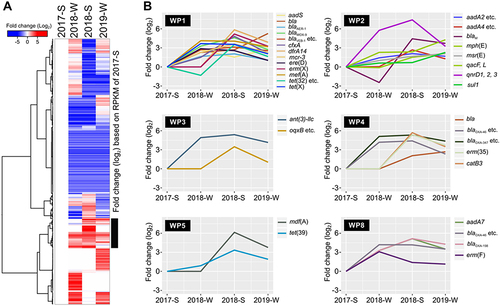
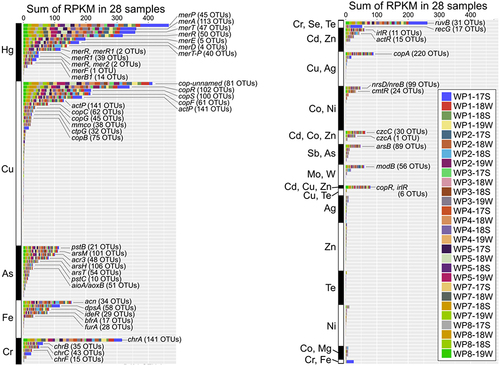
Figure 6 Metagenomic analysis of HMRGs in WWTP effluents. (A) HMRGs in the effluents from WWTPs (WP) and a beach sample (BE). Metagenomic DNA-seq short reads were analyzed for homology using the BacMet2 database (bioinformatics resource of antibacterial biocide- and metal resistance genes; http://bacmet.biomedicine.gu.se/), followed by RPKM normalization. See Supplementary Table 3 for the complete list of metal resistance genes. (B) NMDS plots of metagenomic sequencing reads classified by heavy metal resistance for effluents from WWTPs (WP1 to 9) and BEC1. Freshwater areas in WWTPs (WP1 to 8, see ) were clustered (gray-shaded square), but the clusters were separated in a sampling time-dependent manner that was partially WWTP-dependent.
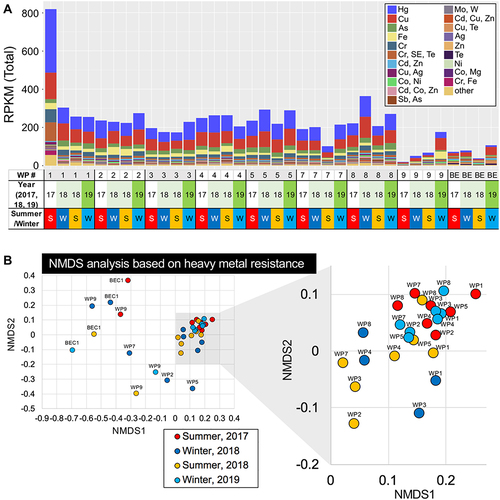
Figure 7 HMRG profiling. A Trends of metal resistance gene variations, the detected metal resistance genes in each metal at every sampling and WP site. WP1-17S stands for the sample at WP1 site in 2017 summer.