Figures & data
Figure 1 Flow chart of the simplified process. Created with BioRender.com.
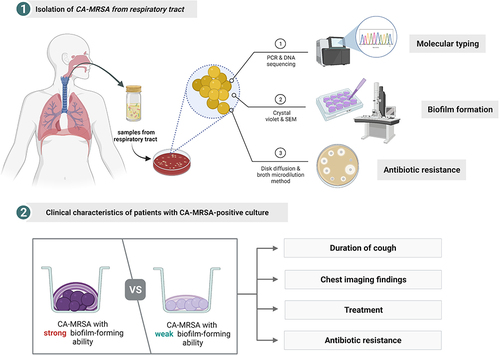
Table 1 General Information and Clinical Characteristics of Enrolled Children
Table 2 The Antimicrobial Resistance Profiling of 53 CA-MRSA Isolates
Figure 2 Molecular characteristics of 53 CA-MRSA isolates. Evolution patterns of the 53 CA-MRSA isolates (calculated by goeBURST hierarchical clustering analysis) and the carriage of PVL genes among the different MLST groups.
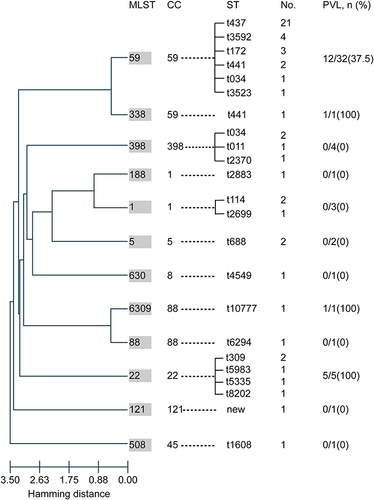
Table 3 Clinical Characteristics Between CA-MRSA Groups with Different Biofilm-Forming Capacity
Figure 3 Biofilm formation by 53 CA-MRSA isolates. (A) Representative images and quantification of biofilm formation of the two CA-MRSA strain groups by crystal violet staining. (B) Representative scanning electron microscopy images of CA-MRSA biofilms in both groups.
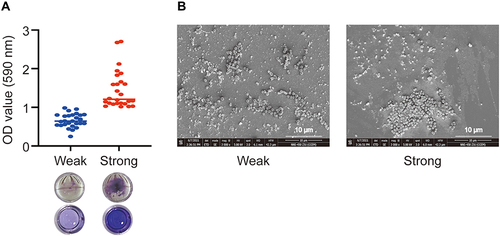
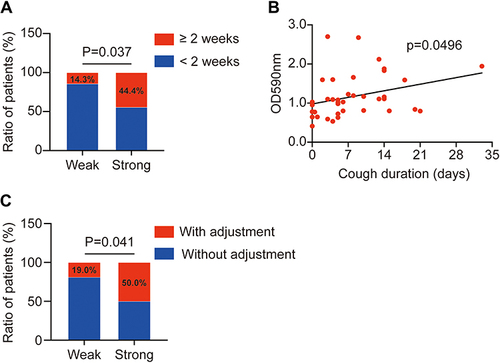
Figure 4 The impacts of CA-MRSA biofilm-forming in children with LRTI. (A) The higher ratio of patients with a duration of cough over two weeks in strong biofilm-forming group (P=0.037). (B) The line graph indicates that CA-MRSA biofilm formation increased the duration of cough in pediatric patients with LRTI (P=0.0496). (C) Higher proportion of patients needing to adjust antibiotics in the strong biofilm-forming group.