Figures & data
Figure 1 Flow chart of cases inclusion and exclusion.
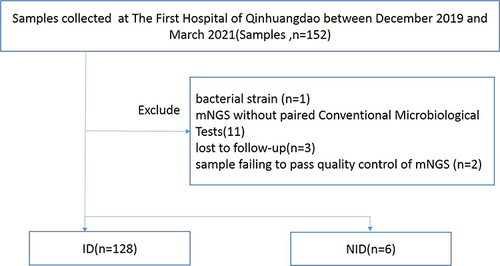
Figure 2 Schematic of metagenomic next-generation sequencing and analysis. (A) The wet lab pipeline including nucleic acid extraction, library construction and sequencing. (B) Dry lab pipeline including quality control, human host subtraction, alignment to reference database and report generation.
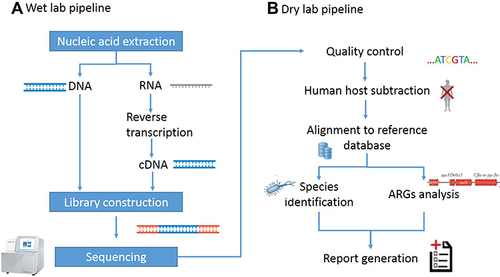
Table 1 Demographics Characteristics of Samples
Table 2 Distribution of Sample Types
Figure 3 Distribution of the infectious diseases of clinical specimens. The pie chart demonstrated the cause of the retrospective diagnosis in ID (95.5%) and NID (4.5%) groups. Lower respiratory tract infection accounted for 70.9% of cases in ID groups, followed by bloodstream infection (7.5%), central nervous system infections (5.2%), intra-abdominal infection (4.5%) multifocal infections (3.9%), fever of unknown origin (3.1%), and skin and soft tissue infections (0.8%).
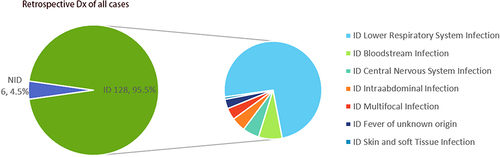
Figure 4 Diagnostic performance comparison of mNGS and CMT. (A) Positive and negative samples (y-axis) for pairwise mNGS and CMT is plotted against ID, NID group (x-axis). (B) Contingency tables showed the sensitivity and specificity of mNGS and CMT respectively. mNGS increased the sensitivity in comparison with that of culture (P < 0.001) while there were no differences in specificity between them (P > 0.05). (C) Pie chart demonstrated the positivity distribution of mNGS and CMT results from two groups. For the double-positive subset, a proportion of complete matching (22/65) and partial matching (at least 1 pathogen identified in the test was confirmed by the other) (24/65) was observed, with 19 conflicts between mNGS and CMT. (D) For microbes only identified in mNGS, the primary empirical diagnosis was confirmed (23%) or modified (35%) according to mNGS, whereas 13% of the samples were considered unreliable (diagnosis unsupported) and 29% were uncertain.
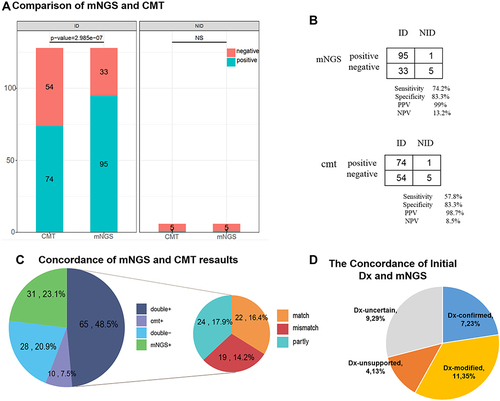
Table 3 “False Positive” and “False Negative”Results of mNGS
Figure 5 The positivity rate between mNGS and culture for different sample types. (A) Compared with the culture, mNGS increased the overall sensitivity by 34.6% (66.3% vs 31.7%). In cases of BALF and blood samples, mNGS detection had significantly higher sensitivity than the culture method (P = 0.034 for BALF, P < 0.01 for blood). (B) In all the 39 cases of BALF sample performed both mNGS and culture, high concordance for pathogen detection of BALF was shown in 16 double-positive cases of mMGS and culture. Only one case of mismatch was observed (2.6%), while 10 cases were total matched (25.6%).
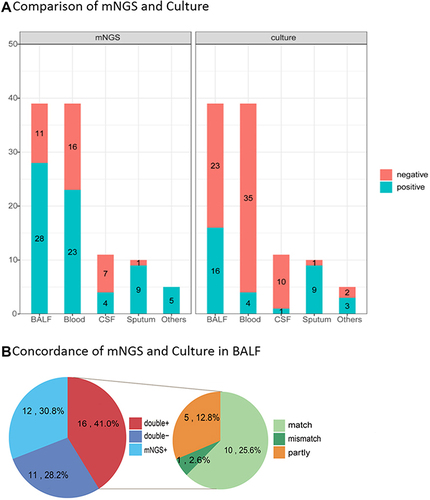
Figure 6 The overlap of positivity in pathogen between mNGS and culture. A total of 40 different pathogens were detected in the infectious disease group with their corresponding frequencies plotted in histograms. The proportion of mNGS positive samples was significantly higher than that of CMT positive samples in terms of MTB, NTM, virus, and fungus (P < 0.05).
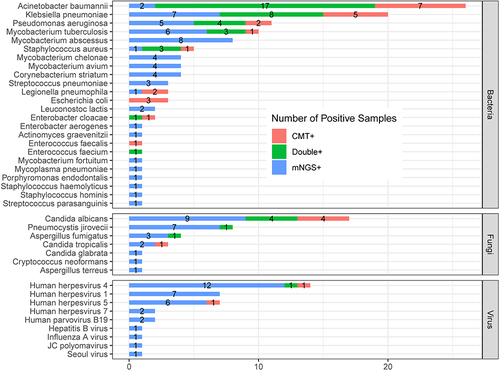
Table 4 Resistance Genes Found by mNGS in Relation to Pathogens
Figure 7 Frequency of ARGs detected from 17 cases that A. baumannii was both positive in mNGS and CMT. A total of 33 antiARGs were detected in 14 cases except 3 negative cases; of which adeL, sul2, and APH(3”)-Ib showed high detection frequency (13/14).
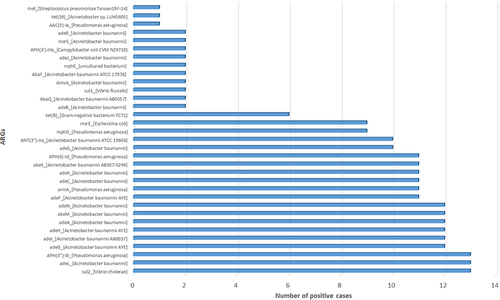
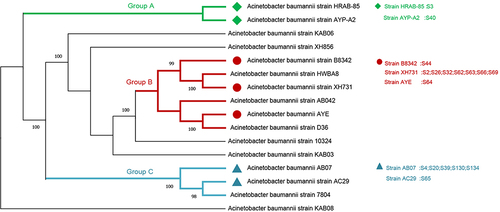
Figure 8 Evolutionary analysis of A. baumannii strains both positive in mNGS and CMT. Among the 17 cases, 15 were clustered in group B or group C, strain XH731 (7 cases of 17, 41.18%) and AB07 (5 cases of 17, 29.41%) were dominant strains.